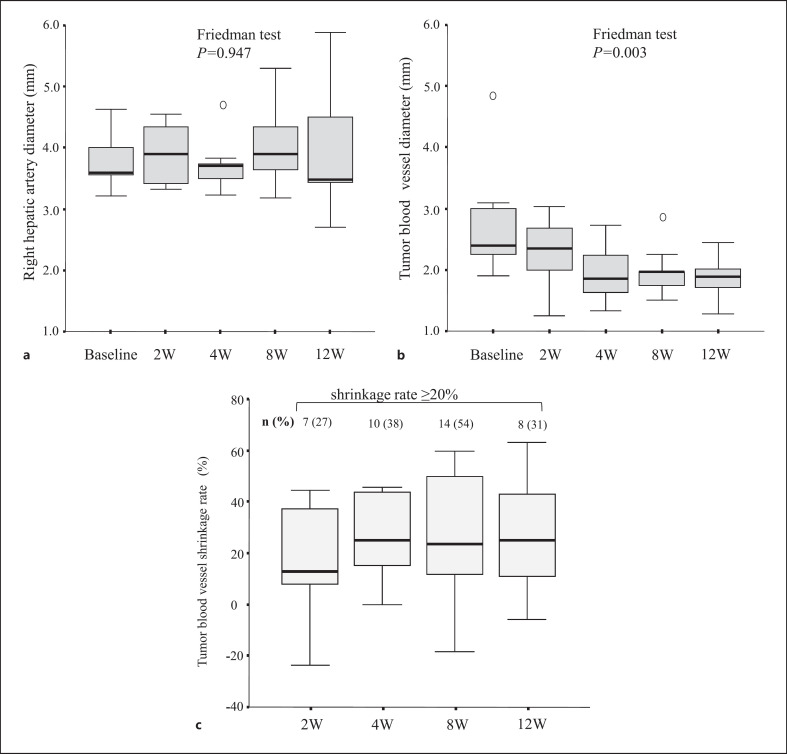
Fig. 1.
Box plots of the changes in blood vessel diameter before and after lenvatinib treatment. a The changes in the right hepatic artery diameter. b The decrease in the TBV diameter. c The shrinkage rate of TBV diameter over time. The number and percentage of participants with a shrinkage rate of 20% or greater at each time point are shown at the top of the plot.

