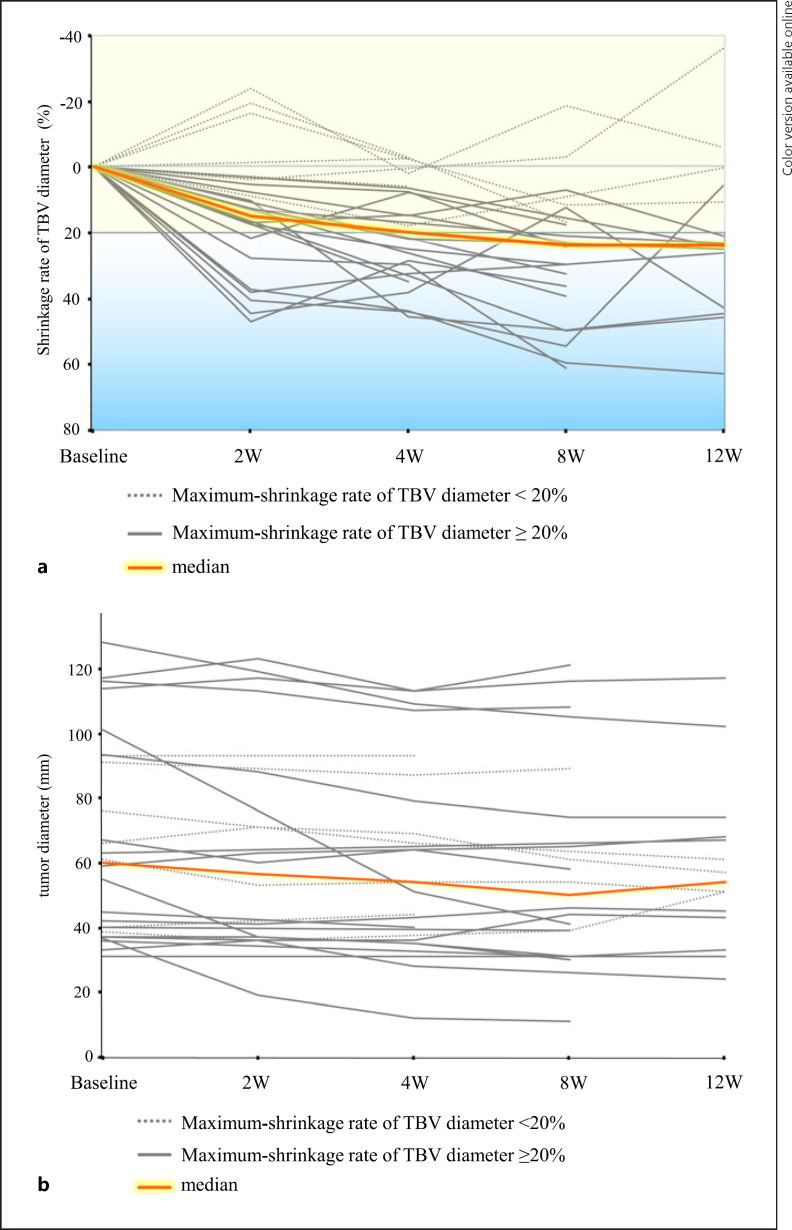
Fig. 2.
a Time course of the TBV diameter shrinkage rate after lenvatinib administration. Dashed gray lines indicate cases in which the maximum shrinkage rate of the TBV diameter was less than 20%. Solid gray lines indicate cases in which the maximum shrinkage rate of the TBV diameter was greater than or equal to 20%. b Changes in tumor diameter up to 12 weeks after lenvatinib administration. Dashed gray lines indicate cases in which the maximum shrinkage rate of the TBV diameter was less than 20%. Solid gray lines indicate cases in which the maximum shrinkage rate of the TBV diameter was greater than or equal to 20%.

