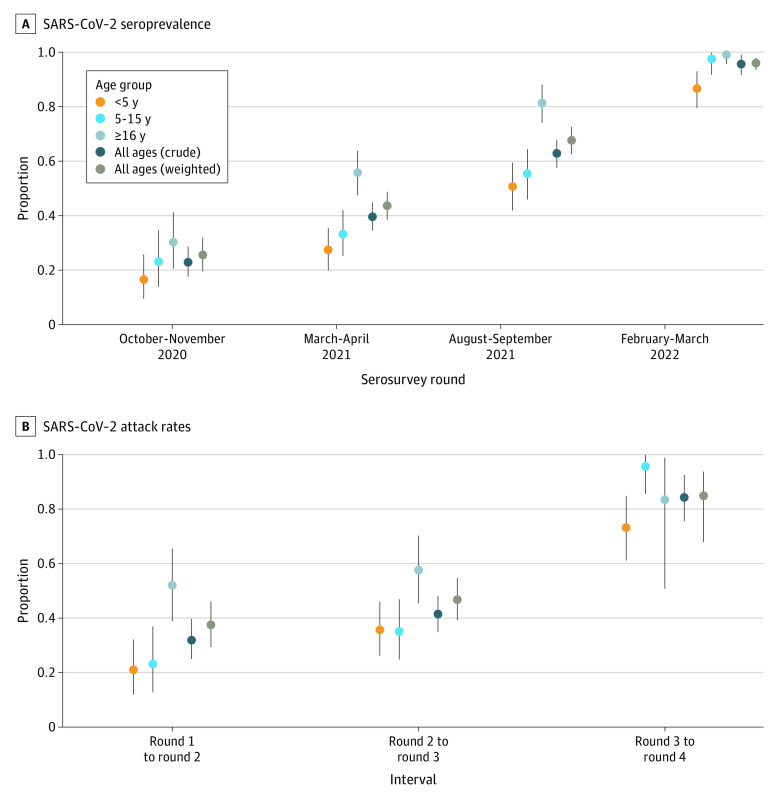
Figure 2. SARS-CoV-2 Seroprevalence and Attack Rates by Age Group and Serosurvey Round.
A, Graph shows posterior median (dots) and 95% credible intervals (error bars) for seroprevalence based on spike protein mean fluorescent intensity (MFI), accounting for test performance characteristics. B, Graph shows posterior median (dots) and 95% credible intervals (error bars) for attack rate based on spike protein MFIs. Individuals who had received SARS-CoV-2 vaccination by a serosurvey round are removed from the attack rate estimation (eg, individuals who were vaccinated at round 4 are removed from the attack rate estimation between round 3 and round 4). The colors represent age group-specific estimates. The dark blue values represent the crude estimates in the cohort. The brown values represent estimates weighted by the local age distribution using 2014 census data from the 3 parishes in Uganda in which study participants reside. All estimates are adjusted for test performance characteristics.

