Figure 3.

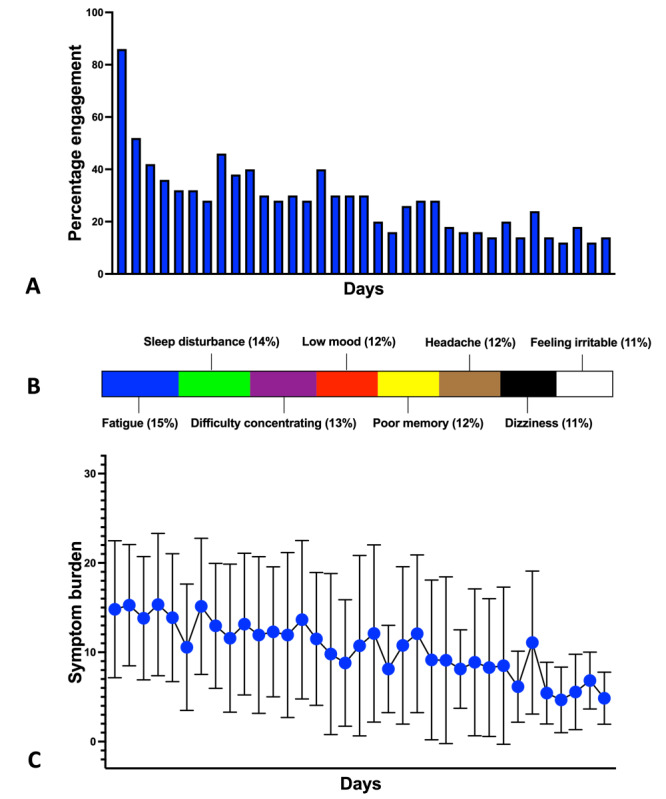
(A) The percentage of study participants completing the symptom diary. (B) Distribution of the symptom burden based on 494 symptom diary responses. (C) Temporal change in symptom burden over the course of HeadOn.

(A) The percentage of study participants completing the symptom diary. (B) Distribution of the symptom burden based on 494 symptom diary responses. (C) Temporal change in symptom burden over the course of HeadOn.