
Figure 3.
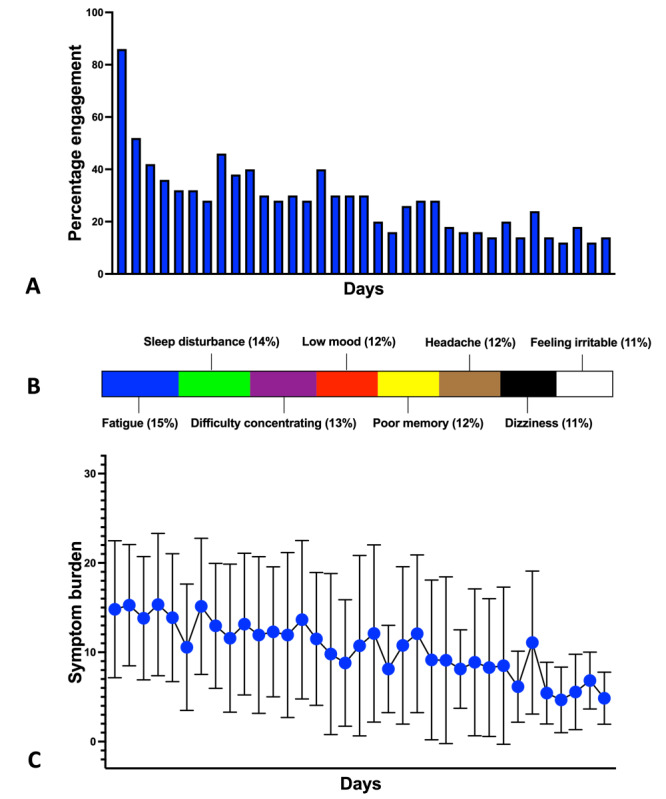
(A) The percentage of study participants completing the symptom diary. (B) Distribution of the symptom burden based on 494 symptom diary responses. (C) Temporal change in symptom burden over the course of HeadOn.
Official websites use .gov
A
.gov website belongs to an official
government organization in the United States.
Secure .gov websites use HTTPS
A lock (
) or https:// means you've safely
connected to the .gov website. Share sensitive
information only on official, secure websites.
(A) The percentage of study participants completing the symptom diary. (B) Distribution of the symptom burden based on 494 symptom diary responses. (C) Temporal change in symptom burden over the course of HeadOn.