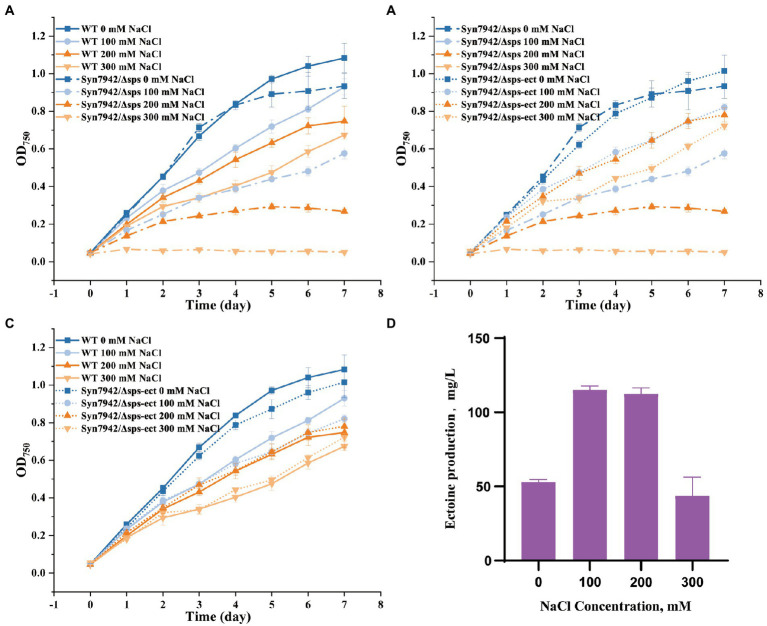
Figure 3.
Growth curves and ectoine production of WT, Syn7942/Δsps, and Syn7942/Δsps-ect. (A) Growth curves of WT and Syn7942/Δsps under 0, 100, 200, 300 mM NaCl; (B) Growth curves of Syn7942/Δsps and Syn7942/Δsps-ect under 0, 100, 200, 300 mM NaCl; (C) Growth curves of WT and Syn7942/Δsps-ect under 0, 100, 200, 300 mM NaCl; (D) Ectoine production of Syn7942/Δsps-ect under 0, 100, 200, 300 mM NaCl.

