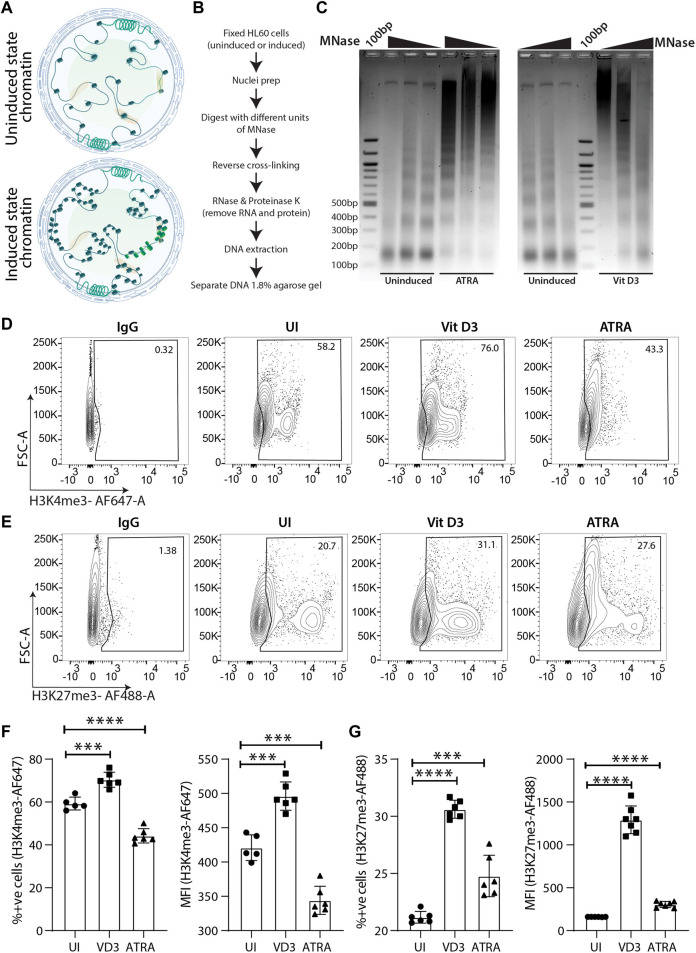
FIGURE 2.
Chromatin dynamics during the course of HL60 differentiation. (A) Schematic representation of the chromatin changes induced in the hematopoietic stem/progenitor cells (HSPCs) upon differentiation. (B) Flowchart showing step wise process for performing the MNase assay. (C) Micrococcal nuclease (MNase) digestion shows the appearance of the nucleosomal ladder in uninduced HL60 and the lack of clear digestion pattern in HL60 induced with ATRA (left) and Vit D3 (right). (D) Contour plots showing gating of stained cells with IgG-AF647, uninduced cells, Vit D3 induced and ATRA induced HL60 cells for 72 h (from left to right) stained with H3K4me3-AF647. The X-axis and Y-axis of the contour plots show H3K4me3-AF647 and forward scatter (A = area) respectively. (E) Contour plots showing gating of stained with IgG-AF488, uninduced cells, Vit D3 induced and ATRA induced HL60 cells for 72 h (from left to right) stained with H3K27me3-AF488. The X-axis and Y-axis of the contour plots show H3K27me3-AF488 and forward scatter (A = area) respectively. (F) Bar plots representing the levels of percent positive cells and MFI intensity of the H3K4me3-AF647 post 72 h of Vit D3 and ATRA induction in HL60. The percent positive cells and MFI of H3K4me3-AF647 were compared with unstained cells (UNS), IgG and uninduced cells (UI) (*** = 0.001, **** = 0.0001). An unpaired t-test was performed using GraphPad Prism version 8.2.1. (G) Bar plots representing the levels of percent positive cells and MFI intensity of the H3K27me3-AF488 post 72 h of Vit D3 and ATRA induction in HL60. The percent positive cells and MFI of H3K27me3-AF488 were compared with unstained cells (UNS), IgG and uninduced cells (UI) (*** = 0.001, **** = 0.0001). All the statistical test was performed as mentioned in GraphPad Prism version 8.2.1.

