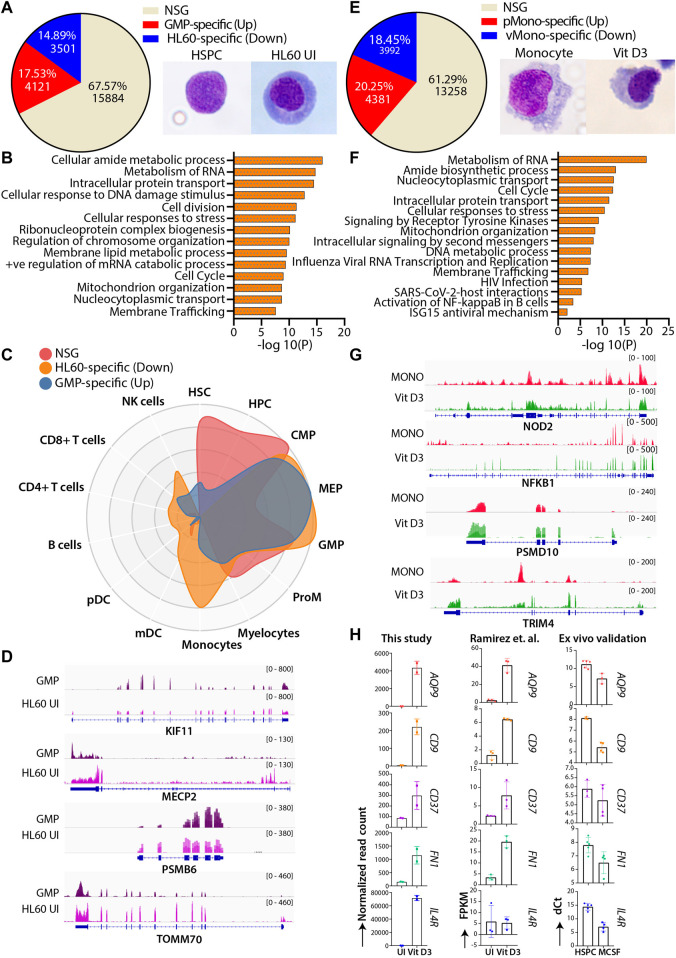
FIGURE 4.
Comparative transcriptomic profiles of the HL60 (n = 2) vs GMP (n = 4) and Vit D3 induced HL60 (n = 2) vs primary monocytes (n = 4). (A) Venn diagram representing the differential gene expression profile of HL60 uninduced cell with GMP. The differential gene expression analysis resulted in upregulated genes (>1-fold change, 17.53%, n = 4121, adjusted p-value ≤0.05), downregulated genes (<1-fold change, 14.89%, n = 3501, adjusted p-value ≤0.05) and genes that did not satisfy |log2FC|>1 and FDR<0.05 (NSG) (67.57%, n = 15884). (B) Bar plots representing the NSG-specific biological pathways (significance -log10 as the p-value) such as cell cycle, translation, intracellular protein transport, metabolism of lipid, and metabolism of RNA conserved between the GMP and the uninduced HL60 cells. (C) CellRadar image representing the overall relatedness between GMP and uninduced HL60 cells. (D) Representative IGV plots showing the gene expression levels of the KIF11, MECP2, PSMB6, and TOMM70 in GMP and uninduced HL60. (E) Venn diagram representing the differential gene expression profile of Vit D3 induced-monocytes with primary monocytes. Overall relatedness of the primary bone marrow monocytes with the Vit D3 induced monocytes. The differential gene expression analysis for the Vit D3-induced monocytes showed upregulated genes (>1-fold change, 20.25%, n = 4381, adjusted p-value≤0.05), downregulated genes (<1-fold change, 18.45%, n = 3992, adjusted p-value ≤0.05) and genes that did not satisfy |log2FC|>1 and FDR<0.05 (NSG) (61.29%, n = 13258). (F) Bar plots representing the NSG-specific pathways (significance -log10 as the p-value) conserved between Vit D3 monocytes and primary monocytes such as immune response, translation, nucleocytoplasmic transport, cell cycle, and cellular respiration. (G) Representative IGV plots showing the gene expression levels of the NOD2, NFKBIA, PSMD10, and TRIM4 in primary monocytes and HL60 Vit D3 monocytes. (H) Bar graphs showing the normalized read count, n = 2 (left), dCt values of the RT-qPCR validation in the ex vivo cord blood-derived CD34+ differentiation model system (n = 4), and the FPKM values from Ramirez et al. study, n = 3 (right) of the selected genes (CD9, AQP9, IL4R, CD37, FN1) in the uninduced and monocytic conditions.

