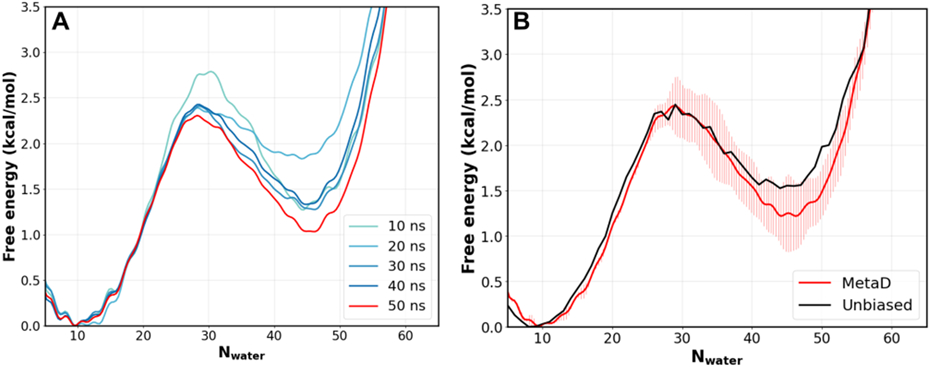
Figure 2. Convergence of MetaD free energy profiles of pore hydration.

A) Free energy profiles of pore hydration as a function of MetaD simulation time, for a pore with radius 6 Å and height of 12 Å. B) Comparison of free energy profiles calculated from 50-ns MetaD simulations and a 500-ns unbiased MD simulation of the same pore. The error bars for the MetaD result reflect the difference between two independent 50 ns runs, and the final trace was plotted using the average of the two runs.
