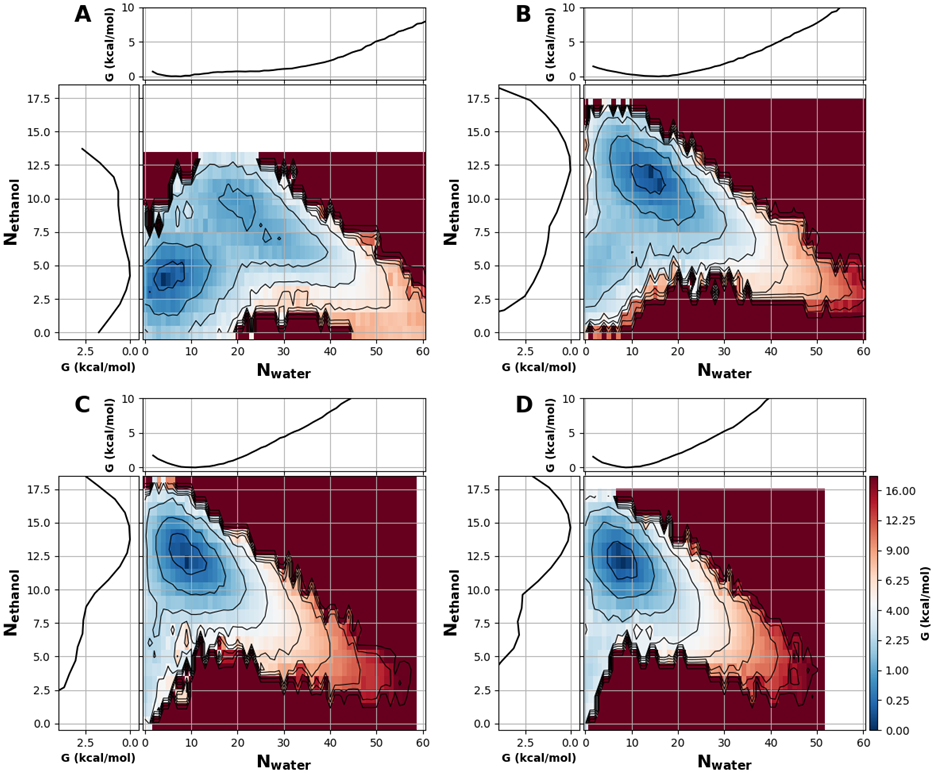
Figure 6. Ethanol effects on hydration property of nanopores.

All 2D PMFs were calculated as a function of pore ethanol and water numbers for a nanopore with a radius 6 Å and height of 16 Å. The ethanol volume fraction is A) 5%, B) 13%, C) 23%, and D) 40%. Black contour lines and color bar ticks are drawn at the same energy levels and are distributed quadratically. In each panel, the marginal projections are the 1D PMFs along Nwater (top) and Nethanol (left). The convergence of these free energy surfaces is illustrated in Figure S11.
