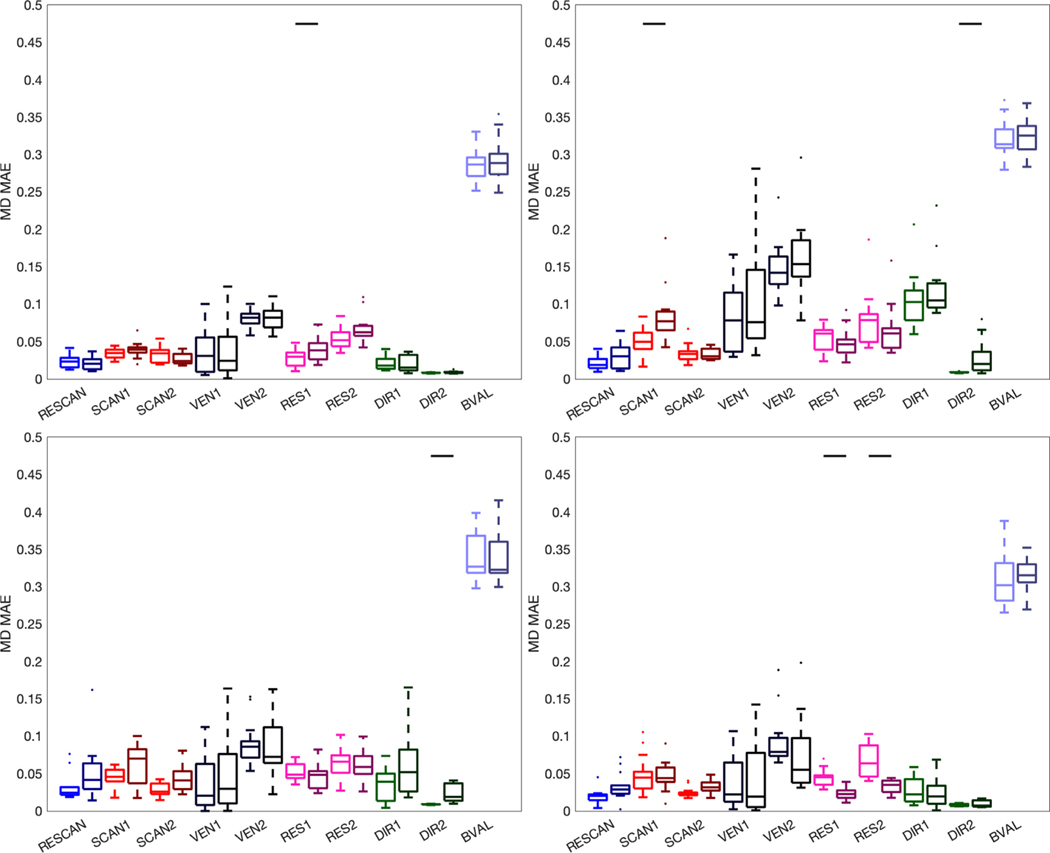
Fig. 12.
Variation of MD. Effects of scan-rescan (RESCAN; blue), scanners (SCAN1, SCAN2; red), vendor (VEN1, VEN2; dark purple), resolution (RES1, RES2; pink), diffusion directions (DIR1, DIR2; green) and b-value (BVAL; light purple) on MAPE of the MD for all fiber bundles dissected using each technique. The left boxplots are indictive of the variability inherent due to each effect, whereas the darker-hued (right) boxplots indicate the added variability due to differences in tractograms. For each, a Wilcoxon signed rank test is performed to investigate whether tractography adds to (or removes) significant variance to this metric, and statistical significance is indicated by a solid black line.

