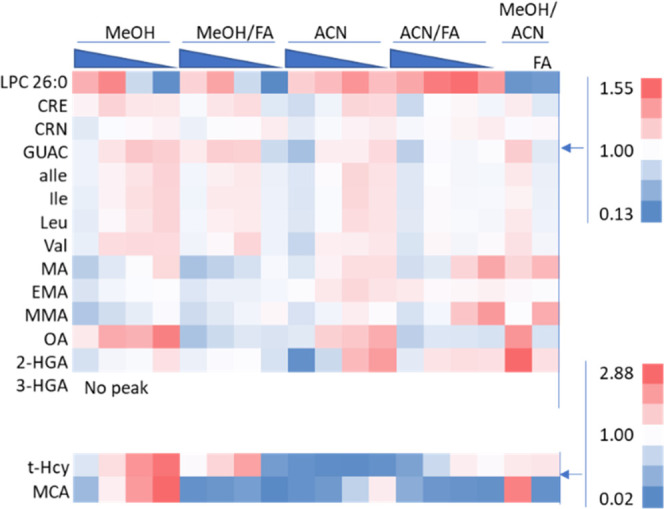
Figure 2.

Heat map showing the effect of the extraction solvent composition on the extracted biomarker peak area fold change relative to the mean peak area of each analyte. Solvents tested include either equal percentages of MeOH/ACN/water (MeOH/ACN) or variable percentages of MeOH/water (MeOH) and ACN/water (ACN), 100/0, 90/10, 80/20, and 70/30, with or without 0.1% FA. Above 1 (mean peak area) is red, below 1 is blue, and 1 is white. The material extracted was the NSQAP QC material lot# D1814.
