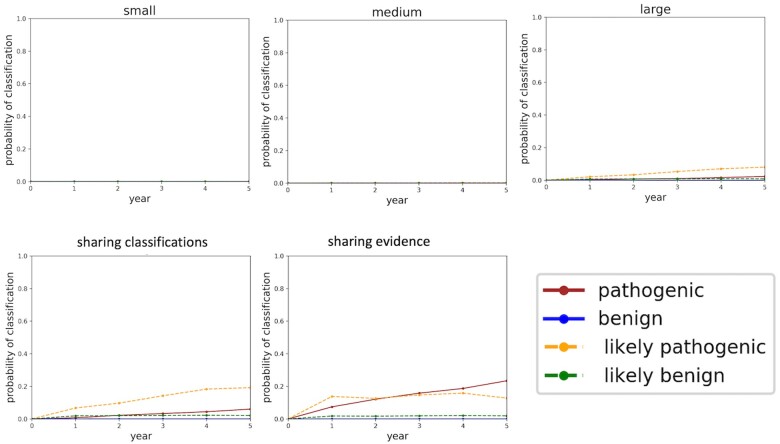
Figure 5.
Probabilities of classifying variants at 1e−06 frequency plotted over the course of 5 years. The y-axis of these plots is the probability of classifying the variant, converted from the aggregated likelihoods of pathogenicity generated in the simulations. Year 0 constitutes the time just before the sequencing centers share their data and all the variants are unclassified. Year 1 constitutes the moment just after the sequencing centers share their data.

