
Figure 4.
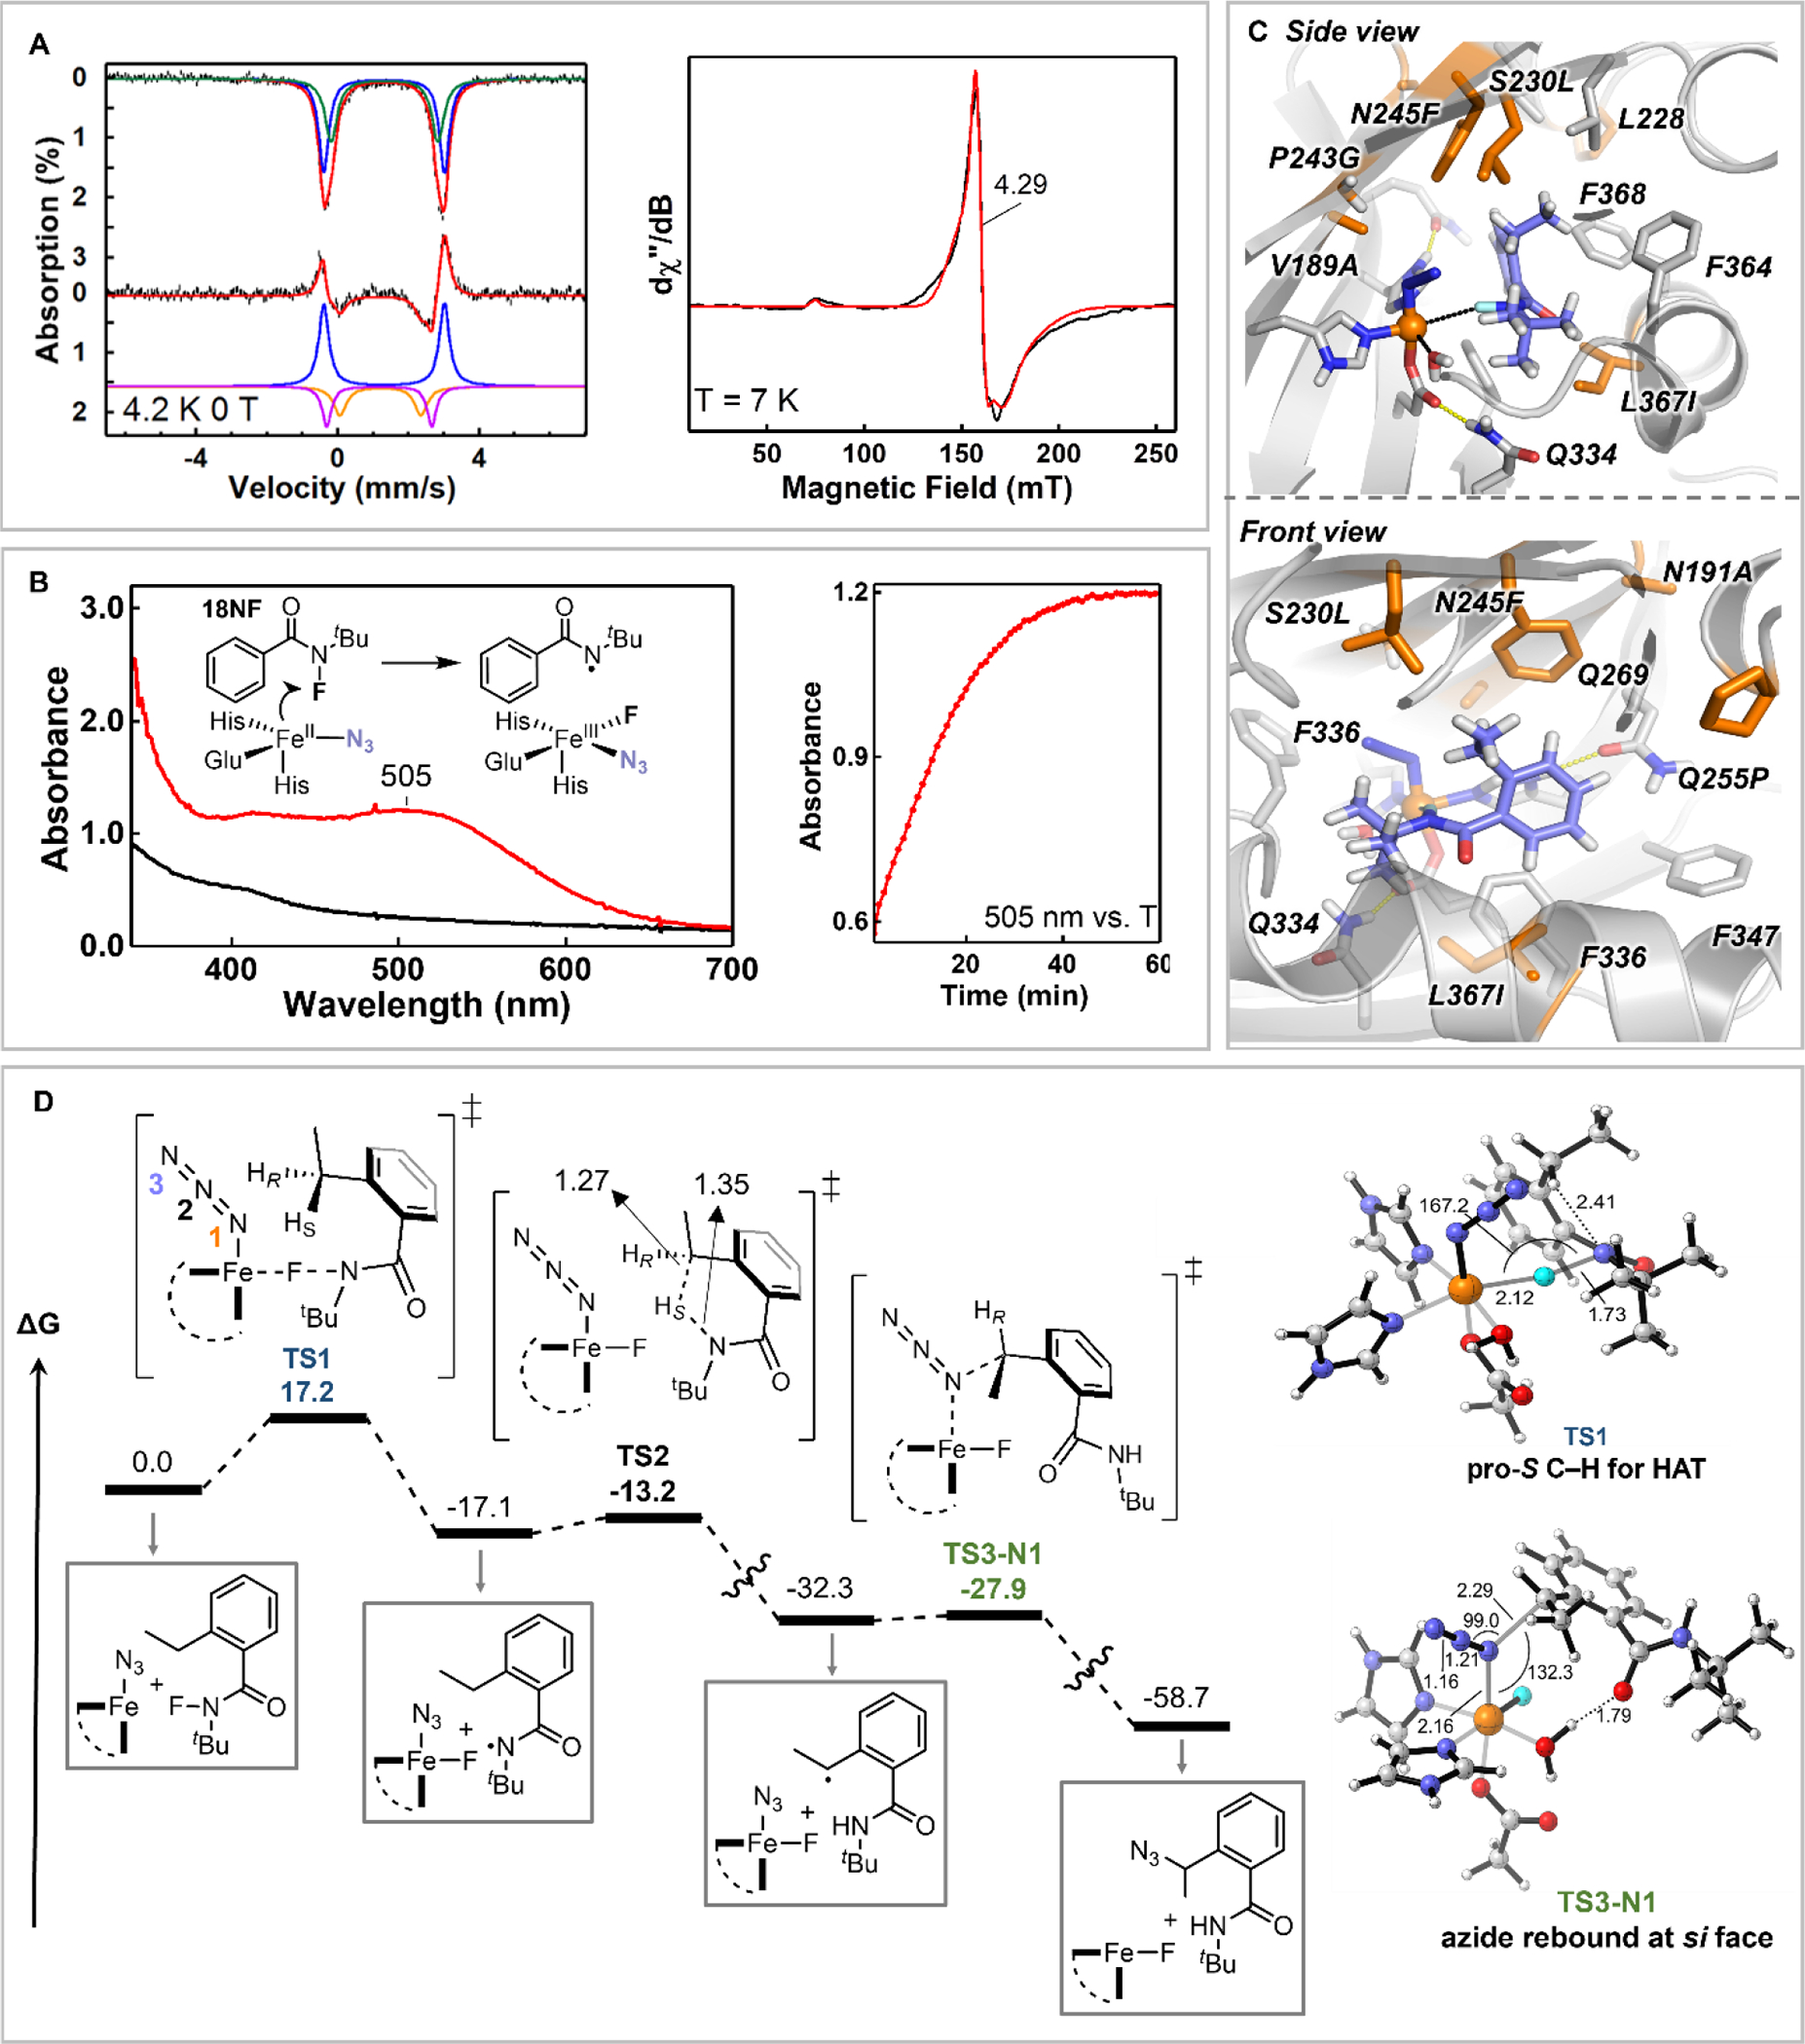
(A) Left: Mössbauer spectrum of Sav HppD Az1•Fe(II) complex (top, black) and the spectroscopic changes upon azide addition (bottom, black). The upward and the downward absorption peaks represent the disappeared and the appeared spectral components after the addition of azide. The colored solid lines represent spectral simulations (see SI for detailed discussion); Right: EPR spectrum of Sav HppD Az1•Fe(II)•N3 complex after incubation with 18NF for 60 min (black) and the spectral simulation (red). (B) Left: Optical absorption spectra of Sav HppD Az1•Fe(II)•N3 complex with 18NF (black) and after incubation with 18NF for 60 min (red). The inset shows the reaction scheme; Right: The time dependent change the 505 nm feature. (C) Active site arrangement of Az2 variant with 1NF substrate bound in a near-attack conformation for N—F activation characterized from MD simulations (see SI for details, Fig. S13). (D) Reaction mechanism obtained from DFT calculations employing a truncated active-site model build from MD simulations (see Fig. S18 for details) (energies in kcal/mol, distances in Å, and angles in deg.).