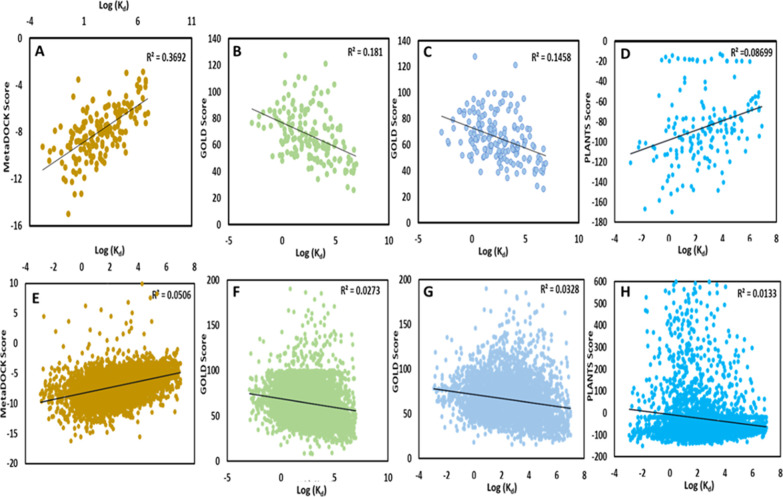
Figure 2.
Scoring power analysis and comparison. Scatter plots of the docking scores and the experimental binding free energies (log Kd) for the core (A–D) and refined sets (E–H), respectively. Trend line is colored in black, while the correlation coefficients between docking scores and experimental binding free energies are represented by R2 values. A–E, B–F, C–G, and D–H show data for MetaDOCK, GOLD_LCTS, GOLD_TS, and PLANTS, respectively. LCTS: largest cluster top score; TS: top score.

