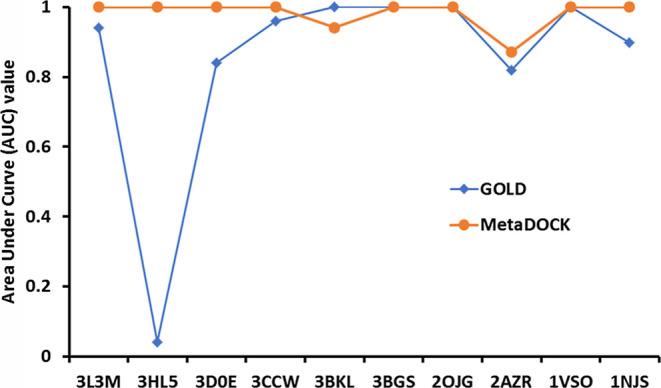
Figure 4.

Screening power analysis and comparison. AUC values extracted from the ROC plots generated by calculating the true positive rate (TPR) and false positive rate (FPR) are plotted. TPR and FPR were calculated based on the docking scores of active and decoy ligands for each of the 10 randomly selected target proteins provided in the DUD-E database. PDB codes for the target proteins are marked in the X-axis.
