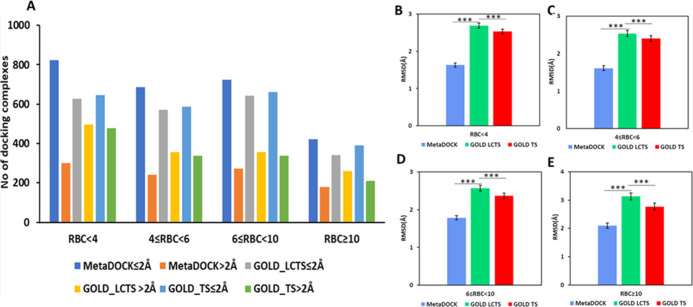
Figure 6.
Rotatable bond count (RBC)-based docking performance analysis and comparison. (A) Plot of the number of successful docking complexes (rmsd ≤2 Å) and complexes with rmsd > 2 Å for four categories of RBC of the ligands, RBC < 4, 4 ≤ RBC < 6, 6 ≤ RBC < 10, RBC ≥ 10. (B–E) Plot of average rmsd of the docked complexes with respect to their corresponding original complexes for various RBC categories. RBC is categorized based on the number of rotatable bonds. *** indicates p-value ≤ 0.001.

