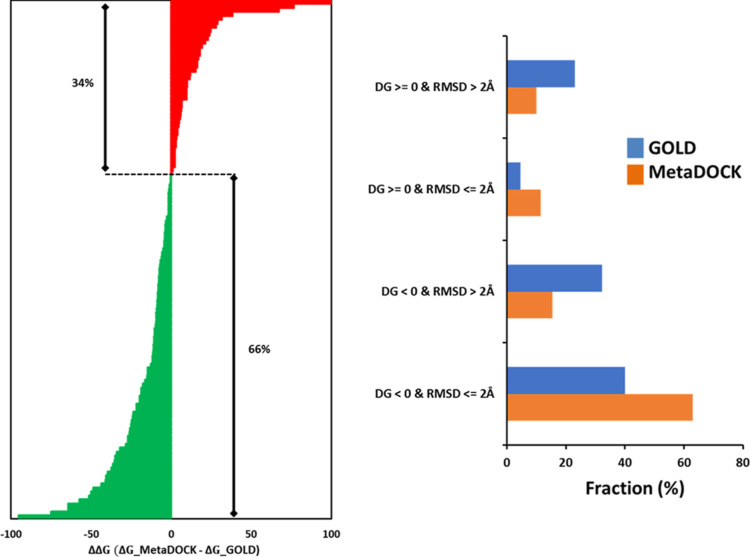
Figure 7.
Molecular dynamics (MD) simulation and MM-PBSA analysis-based energy estimation of the docked complexes. 130 + 130 receptor–ligand docked complexes produced by MetaDOCK and GOLD_LCTS, respectively, were subjected to MD simulations, and ensembles of intermediate complexes were utilized to estimate the binding energy of the initial complex using the MM-PBSA analysis. (A) Plot of the gain/loss of binding free energies (ΔΔG; ΔG of MetaDOCK complex minus ΔG of GOLD complex) of the docked complexes derived by MetaDOCK with respect to complexes obtained via GOLD docking. Gain of binding free energies by MetaDOCK is colored by green, while loss is marked in red color. (B) Plot of the fraction of docking complexes with negative/positive binding free energies (ΔG or DG) along with docking success cutoff represented by rmsd ≤2 Å.

