Figure 3.
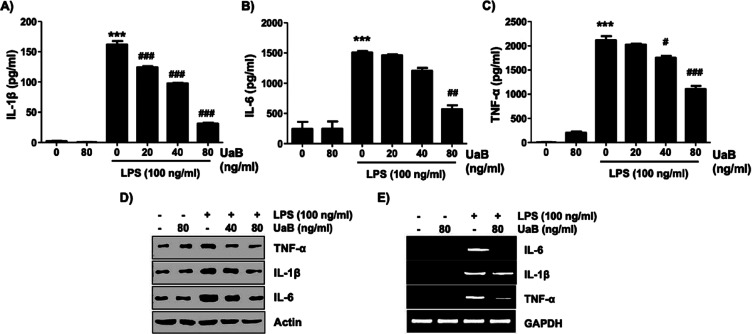
Inhibition of TNF-α, IL-1β, and IL-6 production by the UaB fraction in LPS-stimulated RAW 264.7 macrophages. RAW 264.7 cells were incubated for 1 h with the indicated concentrations of UaB prior to stimulation with LPS (100 ng/mL) for 24 h (A–C). The amounts of TNF-α (A), IL-1β (B), and IL-6 (C) in the culture supernatants were determined using commercial ELISA kits. Values are expressed as the mean ± SD of results obtained from three independent experiments. ***p < 0.0001 vs controls (UaB- and LPS-untreated cells); #p < 0.01, ##p < 0.001, and ###p < 0.0001 vs cells cultured with 100 ng/mL LPS). Total protein was isolated from RAW 264.7 cells pretreated with the indicated concentrations of UaB followed by treatment with 100 ng/mL LPS for 24 h and subjected to SDS-PAGE. Western blot analyses were performed using the indicated antibodies and an enhanced chemiluminescence detection system (D). RAW 264.7 cells were pretreated with UaB for 1 h followed by treatment with 100 ng/mL LPS for 24 h, and the total RNA was isolated. The mRNA expression of TNF-α, IL-1β, and IL-6 was analyzed using RT-PCR (E). The experiments were repeated three times, and similar results were obtained. Actin and GAPDH were used as internal controls for the western blot and RT-PCR assays, respectively. IL, interleukin; TNF, tumor necrosis factor; RT-PCR, reverse transcription-polymerase chain reaction; and LPS, lipopolysaccharide.

