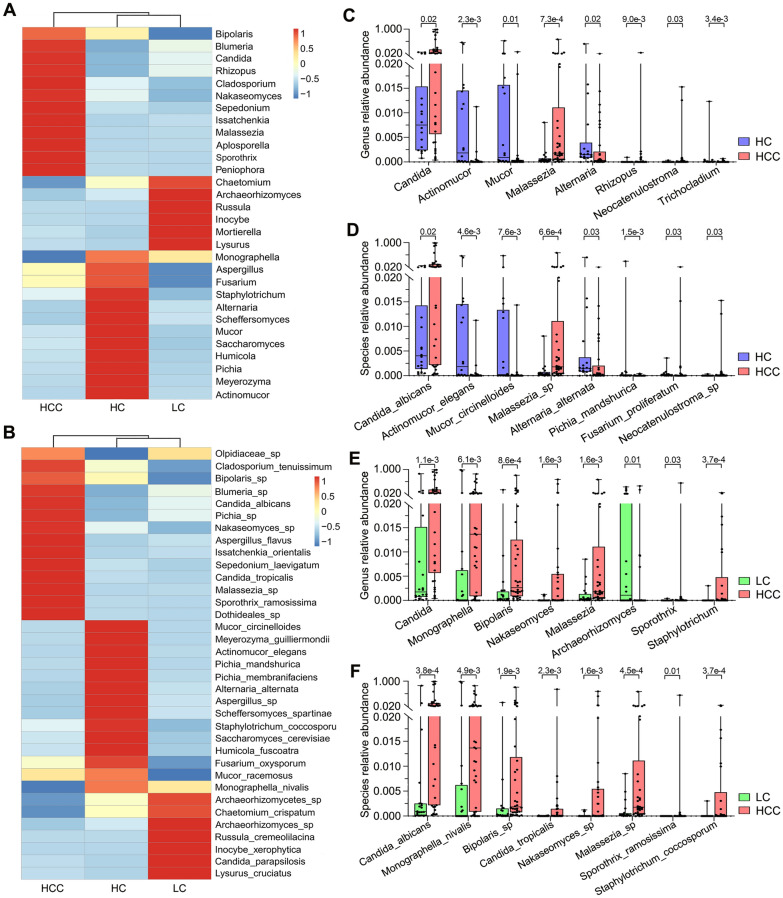
Fig. 2.
Differential analysis of fungal communities in the HCC, LC, and HC groups. A Heatmap of fungal abundance clustering at the genus level A and species level B. The eight most abundant of the differential taxonomic units at the genus level C and species level D between HCC patients and healthy controls. The eight most abundant of the differential taxonomic units at the genus level E and species level F between HCC patients and cirrhosis patients. The Wilcoxon rank-sum test was used. HCC hepatocellular carcinoma, LC liver cirrhosis, HC healthy controls

