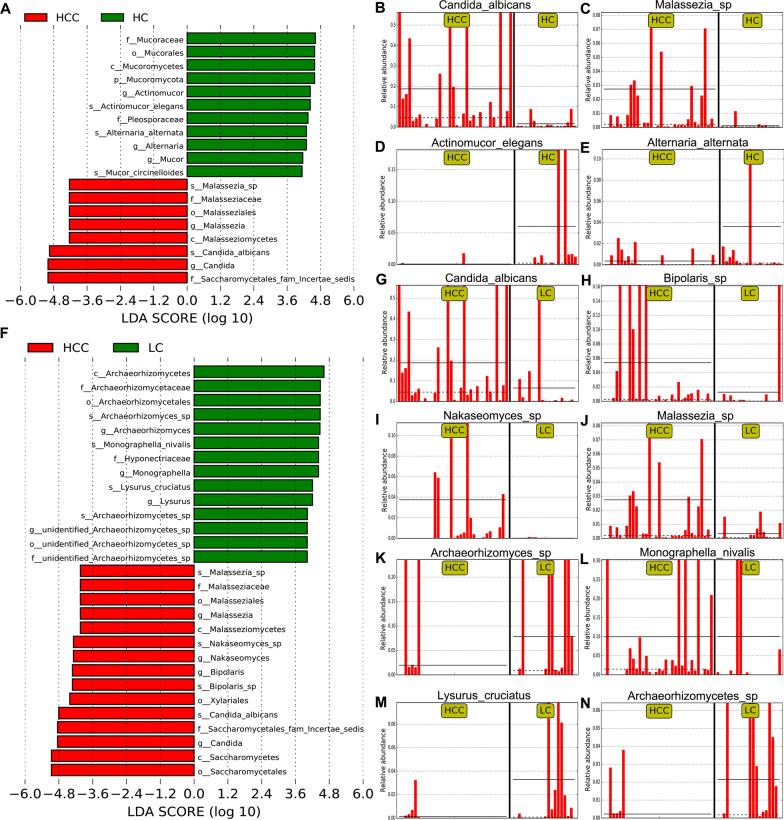
Fig. 3.
The differential taxa in the HCC, LC, and HC groups using the linear discriminant analysis effect size (LEfSe) analysis. A LDA scores were computed for differentially abundant taxa in the gut fungi of HCC patients and healthy controls. F LDA scores were computed for differentially abundant taxa in the gut fungi of HCC patients and cirrhosis patients. Length indicates the effect size associated with a taxon. P = 0.05 for the Kruskal-Wallis sum-rank test; LDA score > 4. B–E, G–N The histogram of the relative abundance distribution of each taxon at the species level. HC healthy controls, HCC hepatocellular carcinoma, LC liver cirrhosis, LDA linear discriminant analysis

