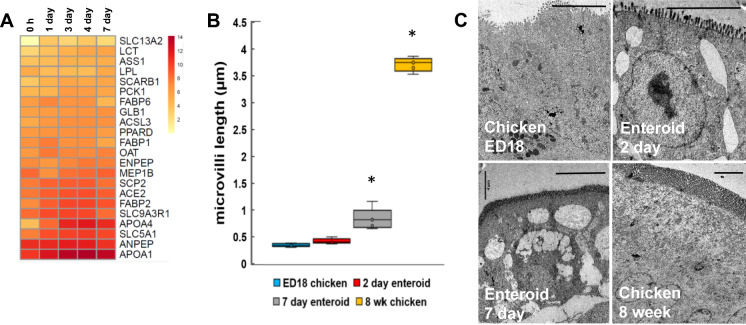
Figure 6.
Single gene analyses of development and function of the enteroid cultures. Expression of A digestion related genes in ED18 intestinal villi (0 h) and enteroids at 1, 3, 4 and 7 days of culture were analysed by RNA sequencing. Heat maps show the mean relative expression levels (log2 counts per million reads) of a range of mammalian gene-sets. RNA sequencing data is representative of 3 independent experiments, each comprising of 2 technical replicates, each containing 3 embryos. B Quantification of microvilli length in ED18 intestine, 3 and 7 day enteroids and 8 week chicken intestine measured from TEM images; averaged for 3 cultures containing 2–3 embryos. *P < 0.05, unpaired Student’s t-test compared to ED18. C Representative TEM images demonstrating microvilli length in ED18 intestine, 2 and 7 day chicken enteroids, and 8 week chicken intestine. Scale bar: 4 µm.

