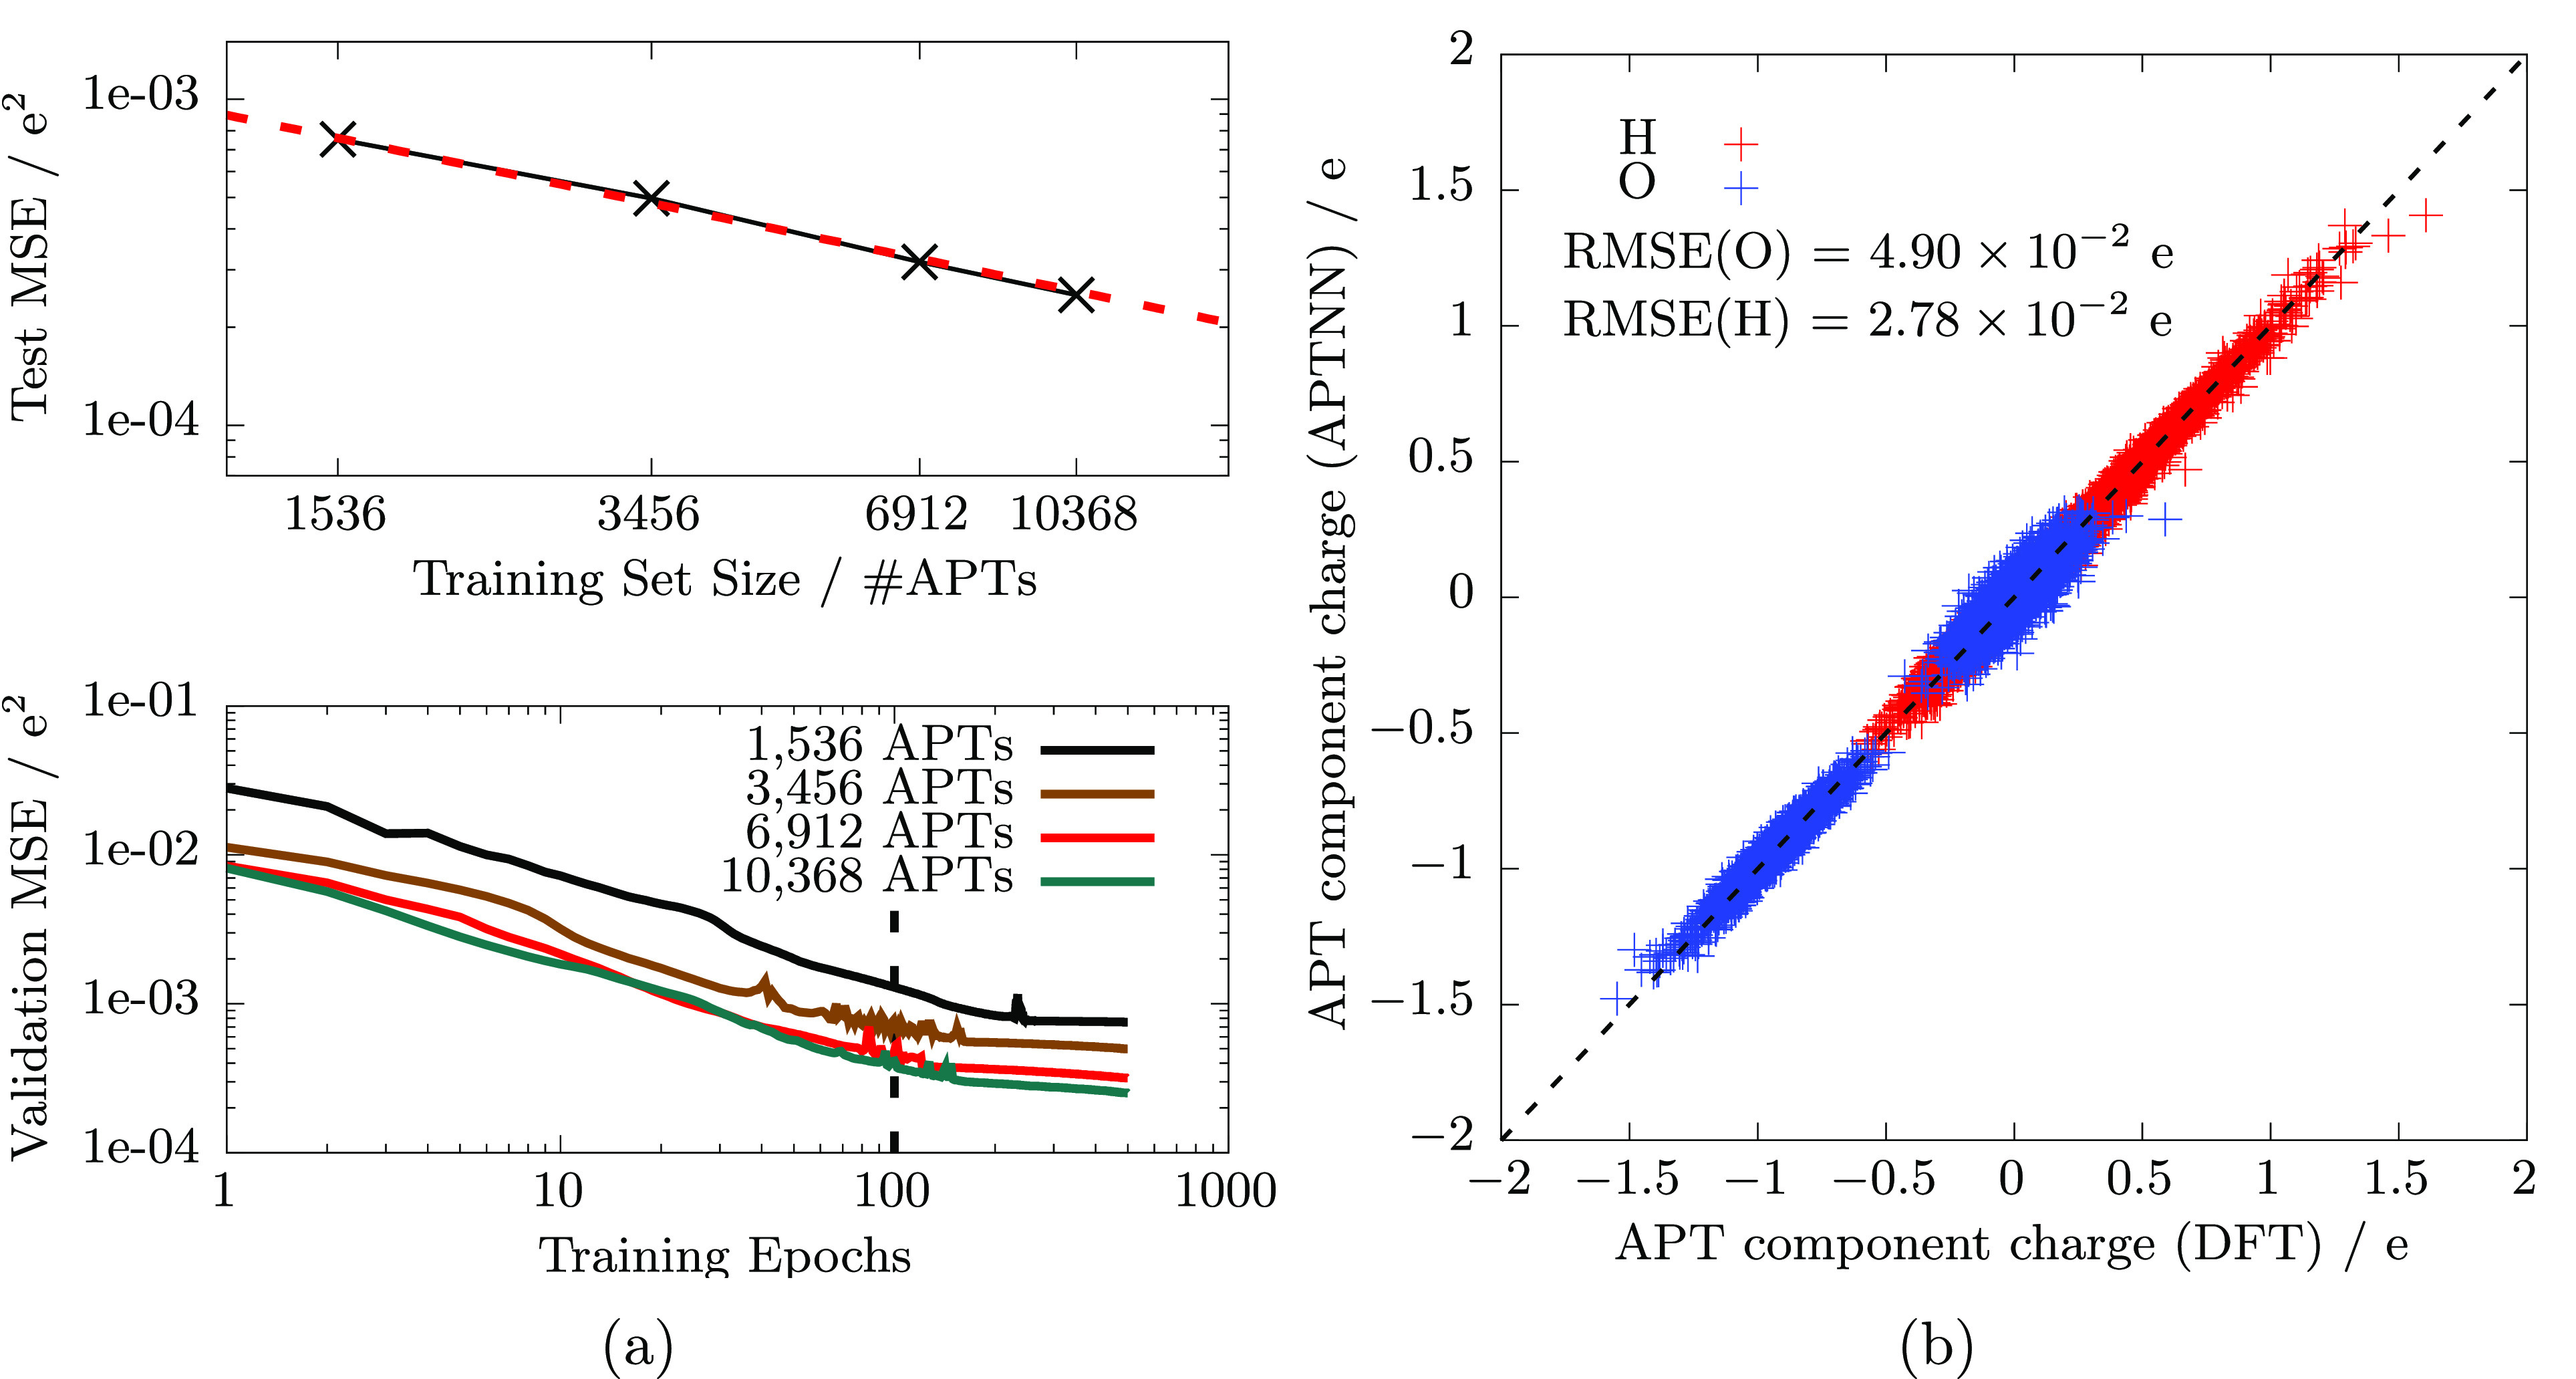
Figure 1.

(a) Test error evaluated on an unknown test set containing 3840 APTs stemming from 10 randomly sampled MD snapshots as a function of training data set size (learning curve, top panel). Mind the log–log scale of the plot and that the expected linear relation (indicated by the red dashed line) is recovered. In the bottom panel, the MSE on the respective validation set is shown as a function of training epoch and training data set size, i.e. four (black), 9 (brown), 18 (red), and 27 (green) MD snapshots, corresponding to 1536, 3456, 6912, and 10368 APTs, respectively. (b) Performance of the APTNN trained on 3840 APTs (9 MD snapshots) on an unknown test set containing 3840 APTs stemming from 10 randomly sampled MD snapshots. The figure compares all components of the APT matrix individually for O (blue) and H (red) atoms. Note that the test set used to benchmark the APTNN in the top panel of (a) and in (b) is the same.
