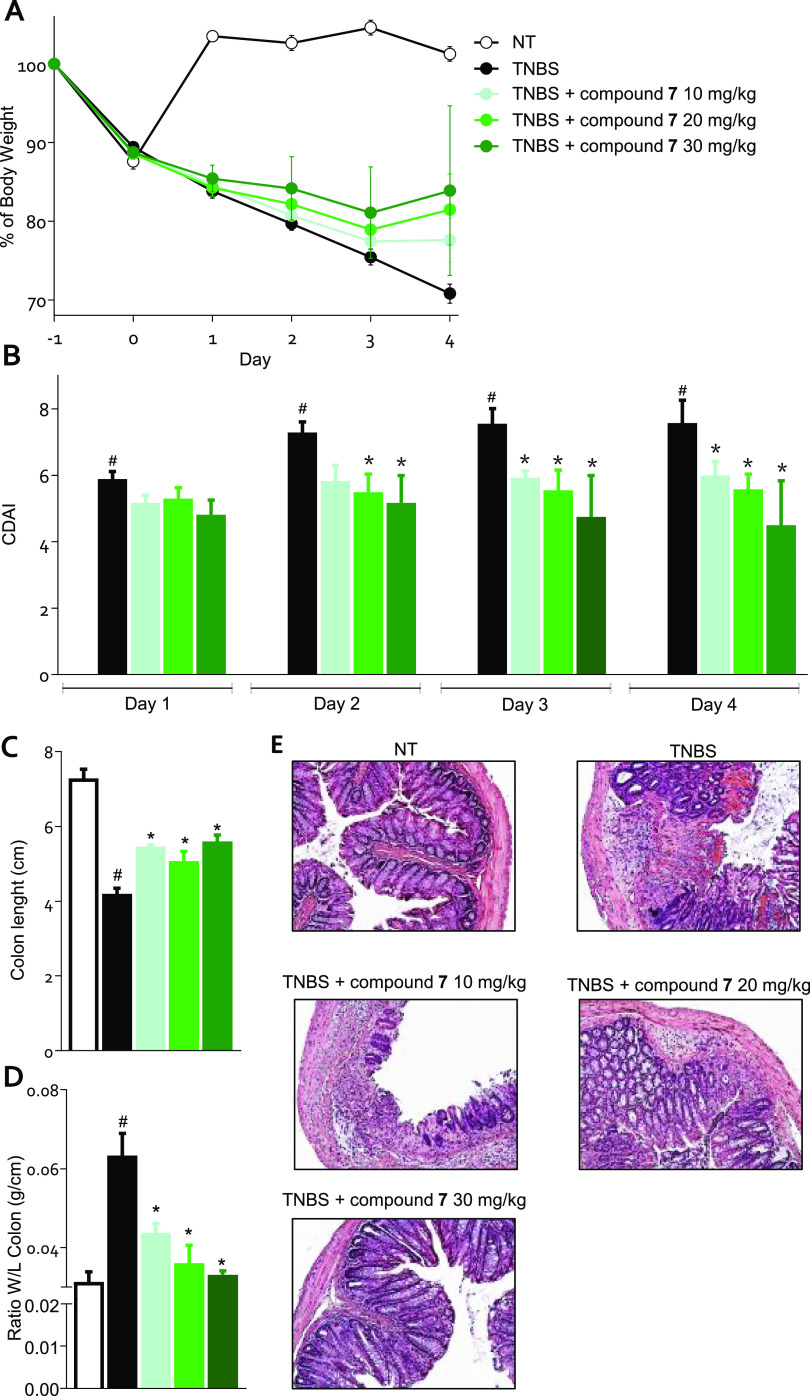
Figure 6.
Mice treated with TNBS were administered with the vehicle or 7 at doses of 10, 20, or 30 mg/kg/day by gavage from day 0 to day 4. (A) Change in body weight, (B) CDAI score, (C) colon length, (D) ratio between colon weight and colon length, (E) H&E staining on colon sections of the control, TNBS-treated, and TNBS plus various concentrations of 7 treated mice. Results are the mean ± SEM of 5–10 mice per group. *p < 0.05 vs TNBS group and #p < 0.05 vs NT group.

