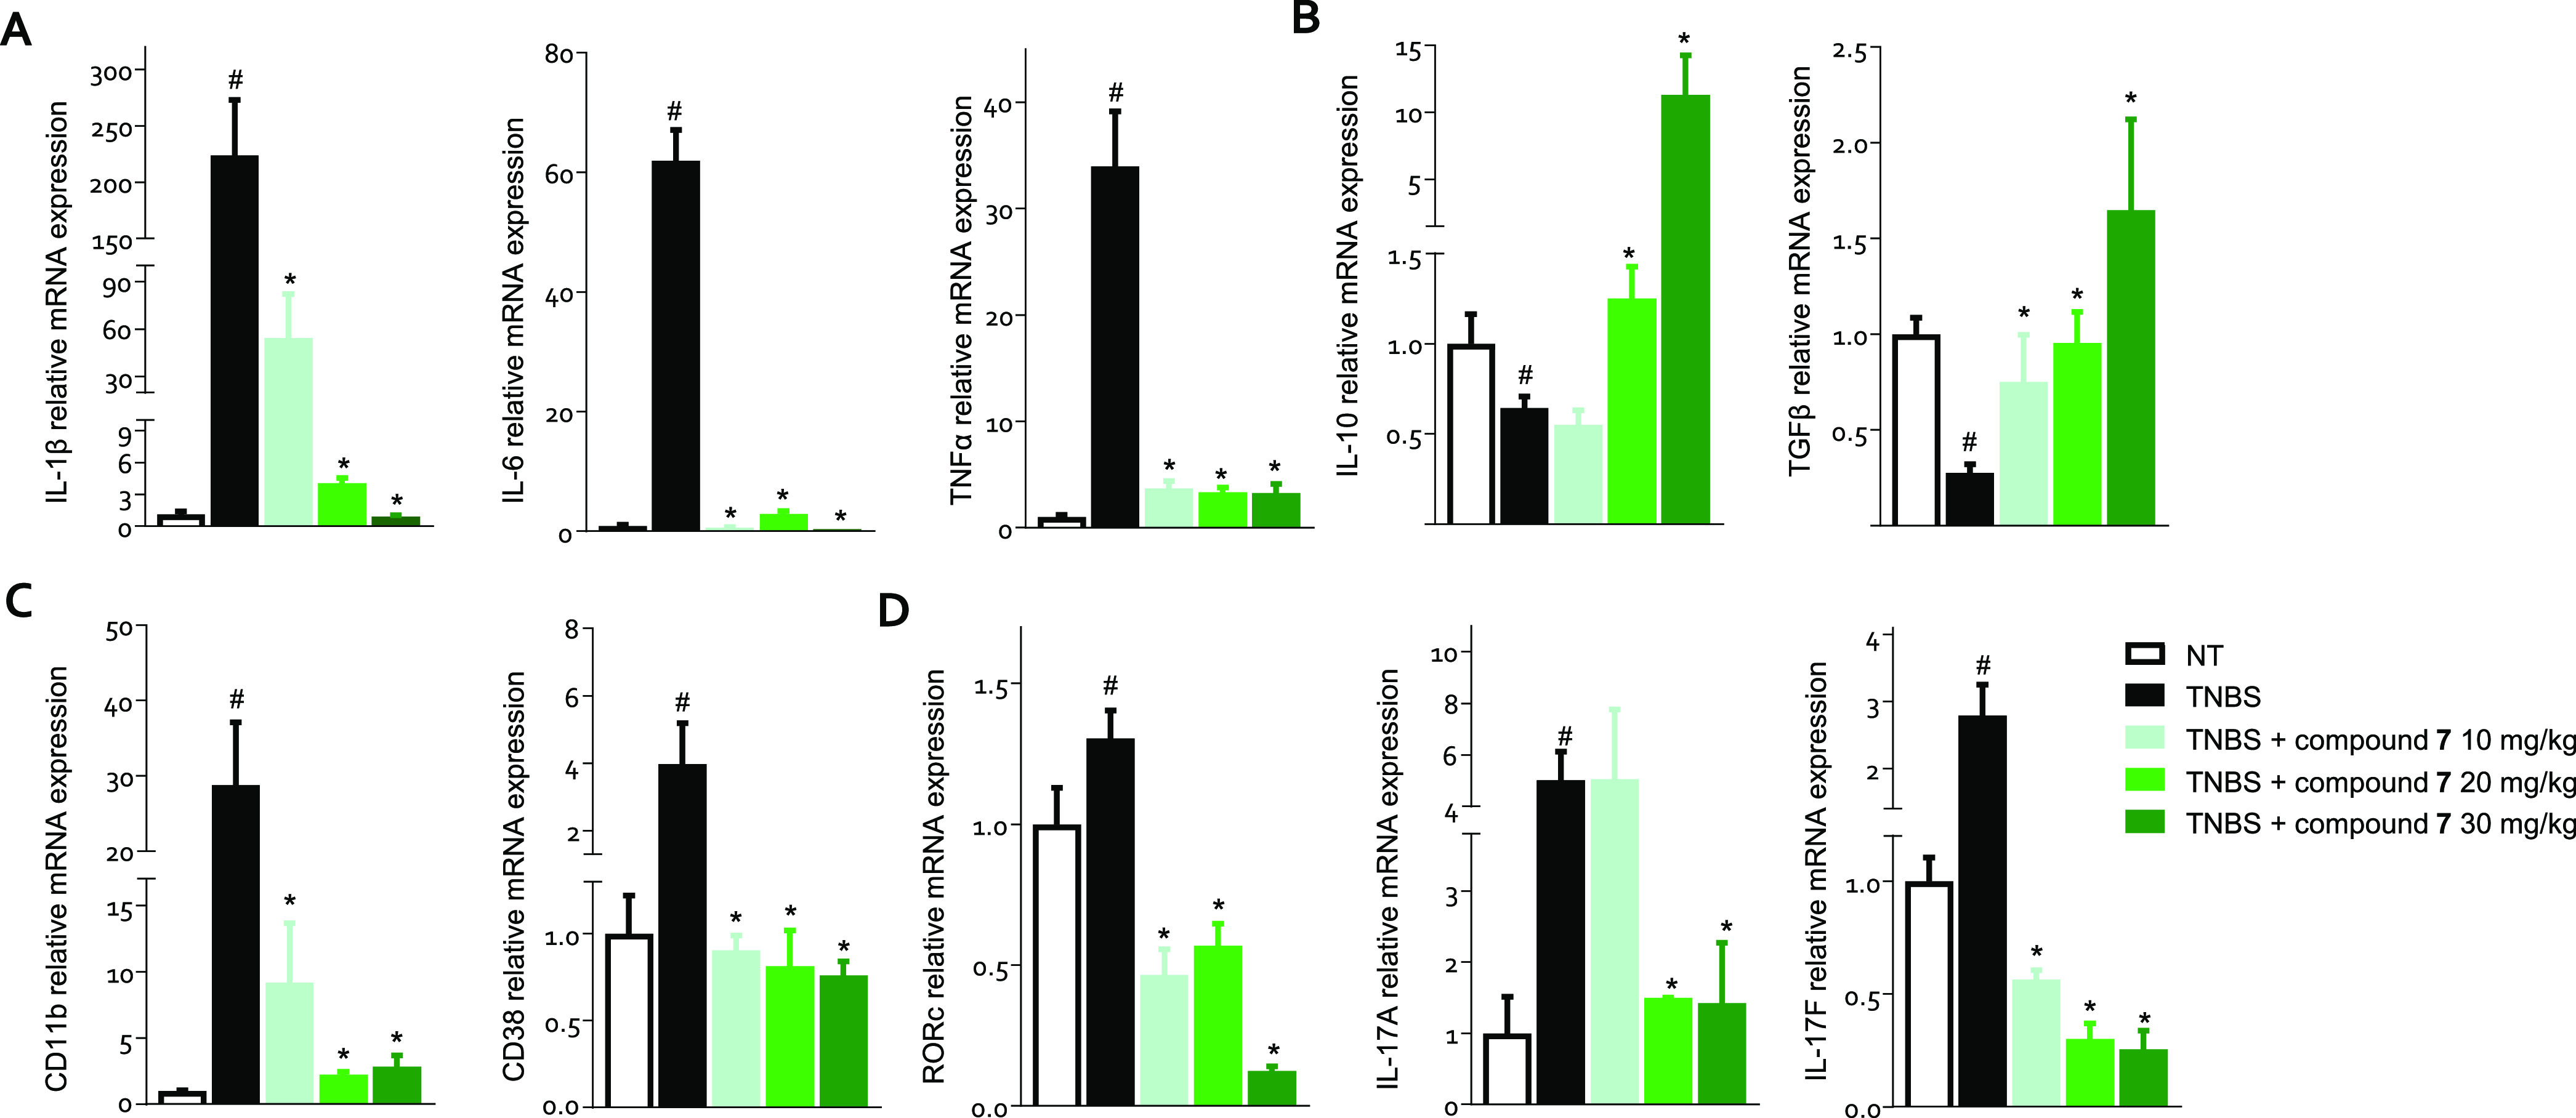
Figure 7.

C57 male mice treated with TNBS were administered with the vehicle or 7 at doses of 10, 20, or 30 mg/kg/day by gavage from day 0 to day 4. The relative mRNA expression of (A) proinflammatory (IL-1β, IL-6, and TNFα) and (B) anti-inflammatory cytokines (IL-10 and TGFβ), (C) macrophage markers, and (D) TH17 cell markers in the colon assayed by RTPCR. Data are normalized to the expression of Gapdh, Tbp, and Actb mRNA. Results are the mean ± SEM of 5–10 mice per group. *p < 0.05 vs TNBS group and #p < 0.05 vs NT group.
