
Figure 3.
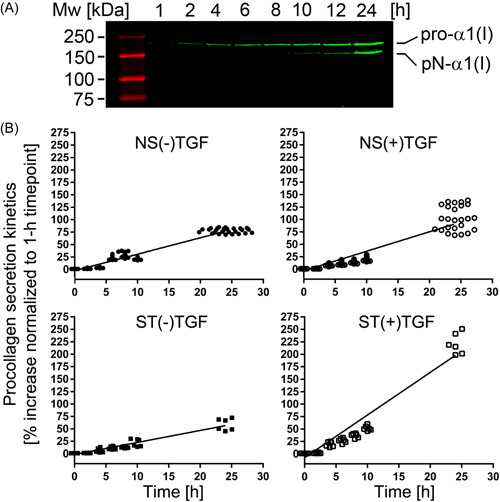
(A) A representative Western blot image of procollagen I secreted into cell culture media during indicated time intervals. Intact pro‐α1(I) chains and partially processed pN‐α1(I) chains are visible. (B) Individual graphs representing the procollagen I secretion rates for the NS and ST fibroblasts grown in the absence or the presence of TGFβ1. NS, nonstiff patients; ST, stiff patients; TGFβ1, transforming growth factor β1.