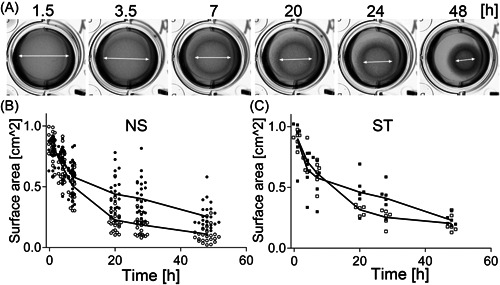
Figure 4.

Analysis of collagen gel contracture by the NS and the ST fibroblasts cultured in the presence and the absence of TGFβ1. (A) Representative images of the fibroblasts‐populated collagen gels observed at indicated time points; arrows indicate changes in the discs' diameters. (B, C) Graphic representations of the changes of the surface areas of the collagen gel discs populated with the NS fibroblasts (B) or ST fibroblasts (C) grown in the presence (open symbols) or the absence (closed symbols) of TGFβ1. NS, nonstiff patients; ST, stiff patients; TGFβ1, transforming growth factor β1.
