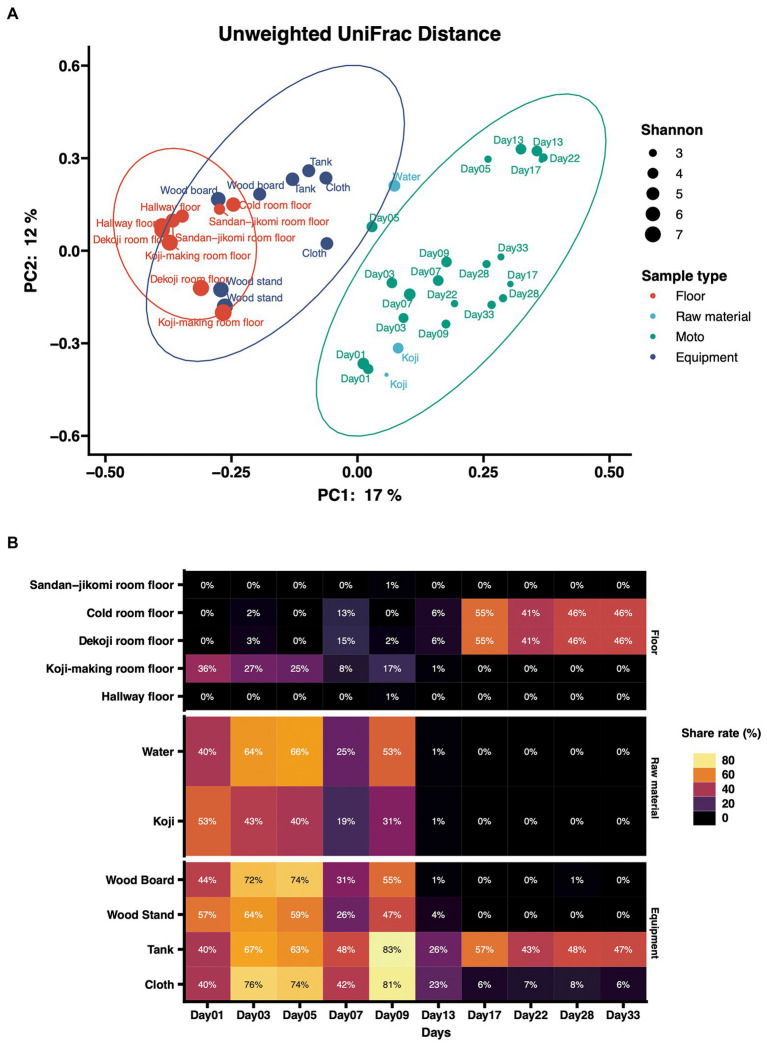
Figure 4.
(A) Principal-coordinate analysis (PCoA) by Weighted UniFrac distance of environmental samples and Moto samples. The dot size shows the values of Shannon diversity of each sample. (B) Time-series changes in the relative abundance of shared ASVs in Moto during the Kimoto-style fermentation period. More than 40% of the microbiomes in Moto on Day 33 shared the ASVs with the tank surface, cold room floor, and Koji-making room floor samples.

