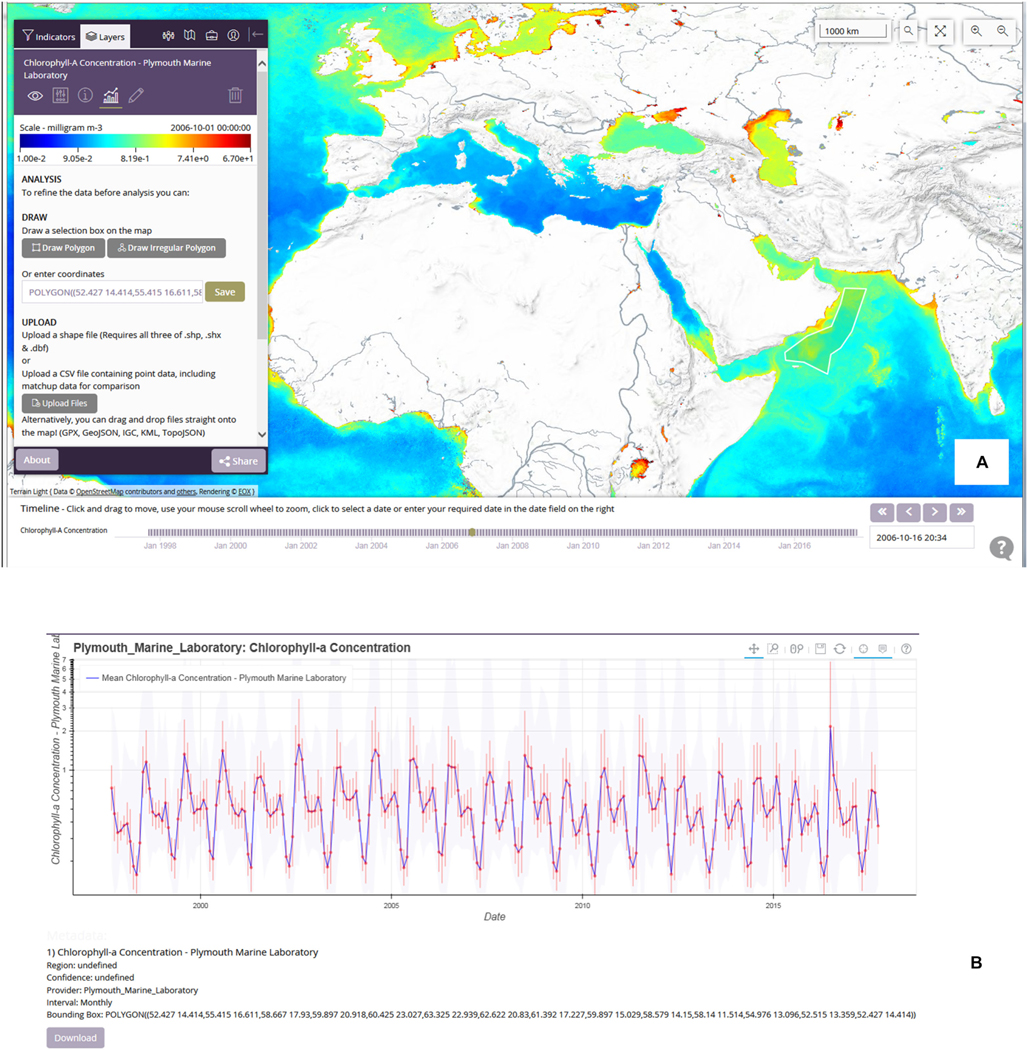
FIGURE 2 |.

Screenshots for ESA ocean colour CCI OGC-compliant visualisation/analysis portal: (A) monthly version 3.1 global chl-a map (comprising merged bias-corrected SeaWiFS, Aqua-MODIS, MERIS and VIIRS) with uploaded shapefile for image data extraction. (B) Time series plot for region of interest; vertical bars show standard deviation and background grey shows range.
