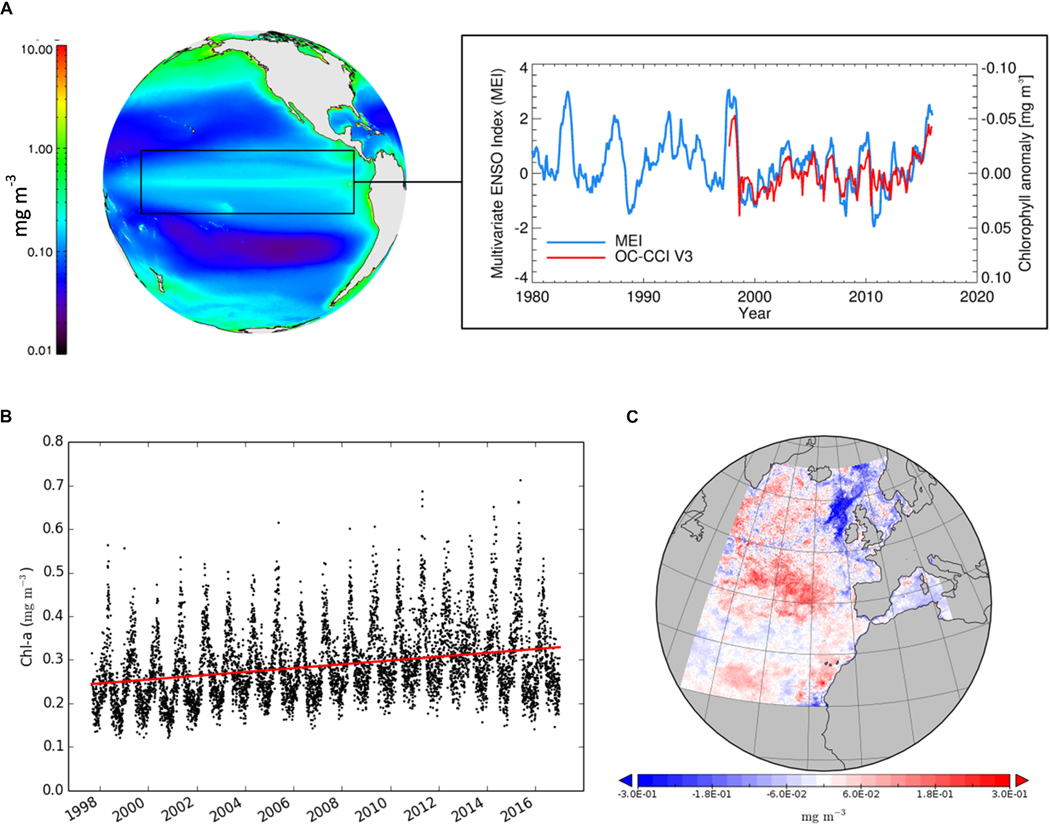
FIGURE 4 |.
(A) Relationship between chl-a and the ENSO climate mode: note that the scale of chl-a anomalies is inverted. chl-a image is from an annual climatology. The monthly multivariate ENSO Index (MEI) was downloaded from the NOAA website (http://www.esrl.noaa.gov/); monthly plotted chlorophyll data were taken from the OC-CCI/CMEMS data set (modified from von Schuckmann et al., 2016); CMEMS north-east Atlantic region: (B) Time series (1997–2016) plot; (C) anomaly map for 2016 (with respect to 1997–2014 reference period) (re-worked from von Schuckmann et al., 2018).

