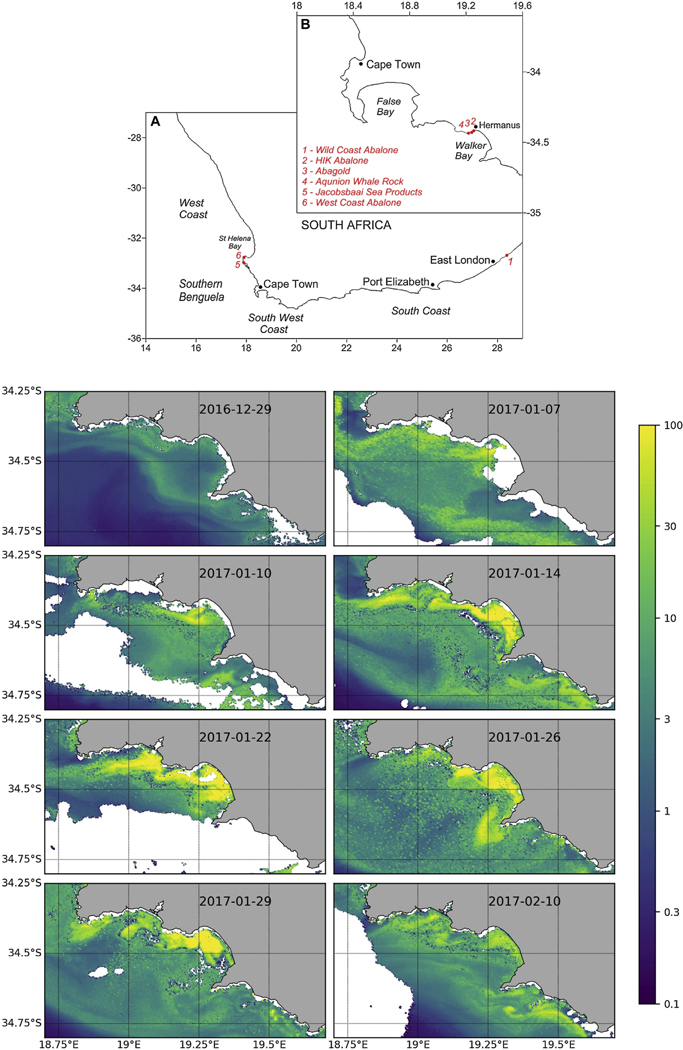
FIGURE 5 |.
(A,B) Map depicting the location of abalone farms on the South African coastline; lower panel shows satellite-derived chl-a concentration (in mg m-3) from the OLCI sensor for the Walker Bay area between the 29th of December 2016 and the 10th of February 2017. White areas represent either cloud or chl-a algorithm failure (Pitcher et al., 2019).

