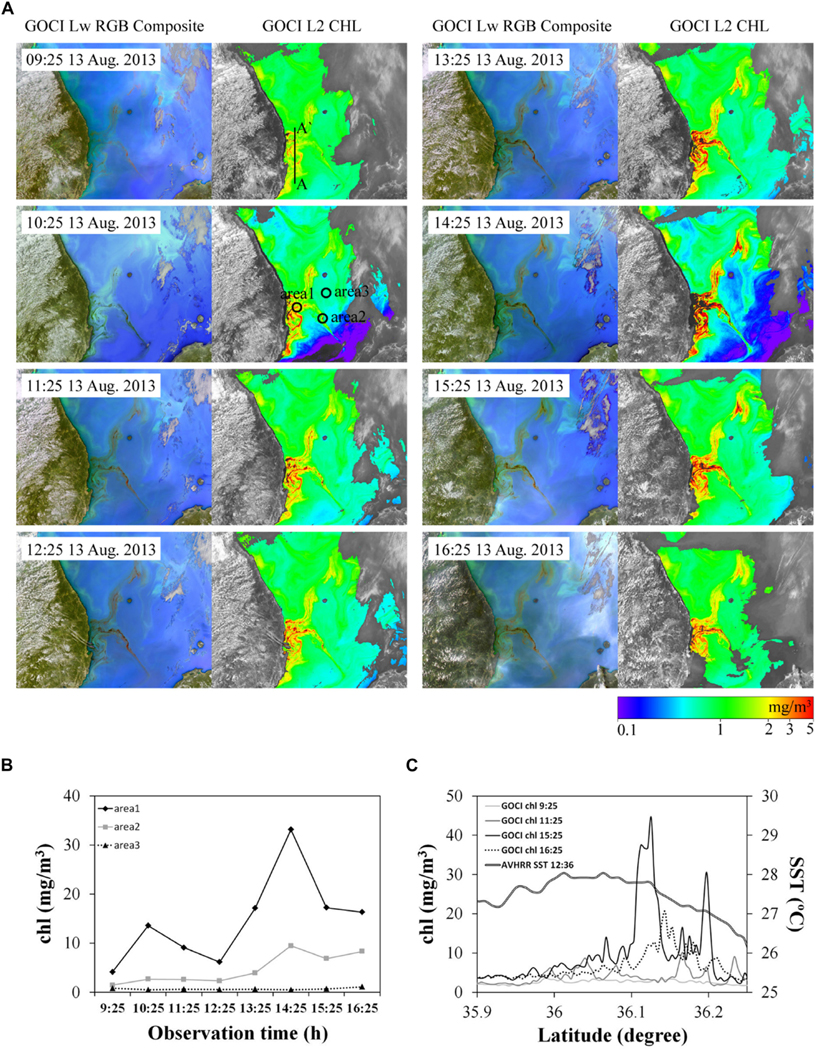
FIGURE 7 |.

(A) Geostationary Ocean Colour Imager radiance composite images and corresponding chl-a images from 09:25 to 16:25 on 13 August 2013: the chl-a profile line (AA′ ) and the hourly chl-a investigation points (1–3) are marked; (B) Hourly GOCI chl-a values at points 1–3; and (C) chl-a values along line AA′ at 09:25, 11:25, 15:25, and 16:25 local time.
