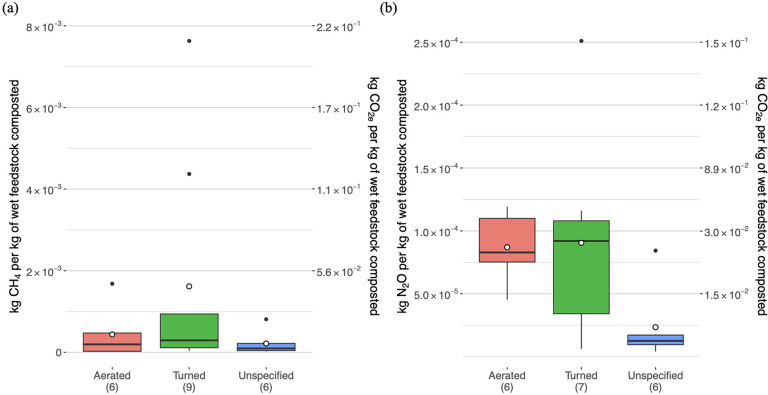
Figure 3.
Distributions of (a) CH4 and (b) N2O emission factors for OFMSW composting based on the aeration method. The sample size (n) of data points contributing to each boxplot is indicated in the x-axis labels. Each figure has two y-axes: the left axis indicates the per-tonne mass of the specified pollutant emitted (exact values), and the right axis shows the CO2-equivalent emission factor (rounded values). The mean values for the boxplot data are indicated by the open point symbols, while outliers are shown as closed circles.

