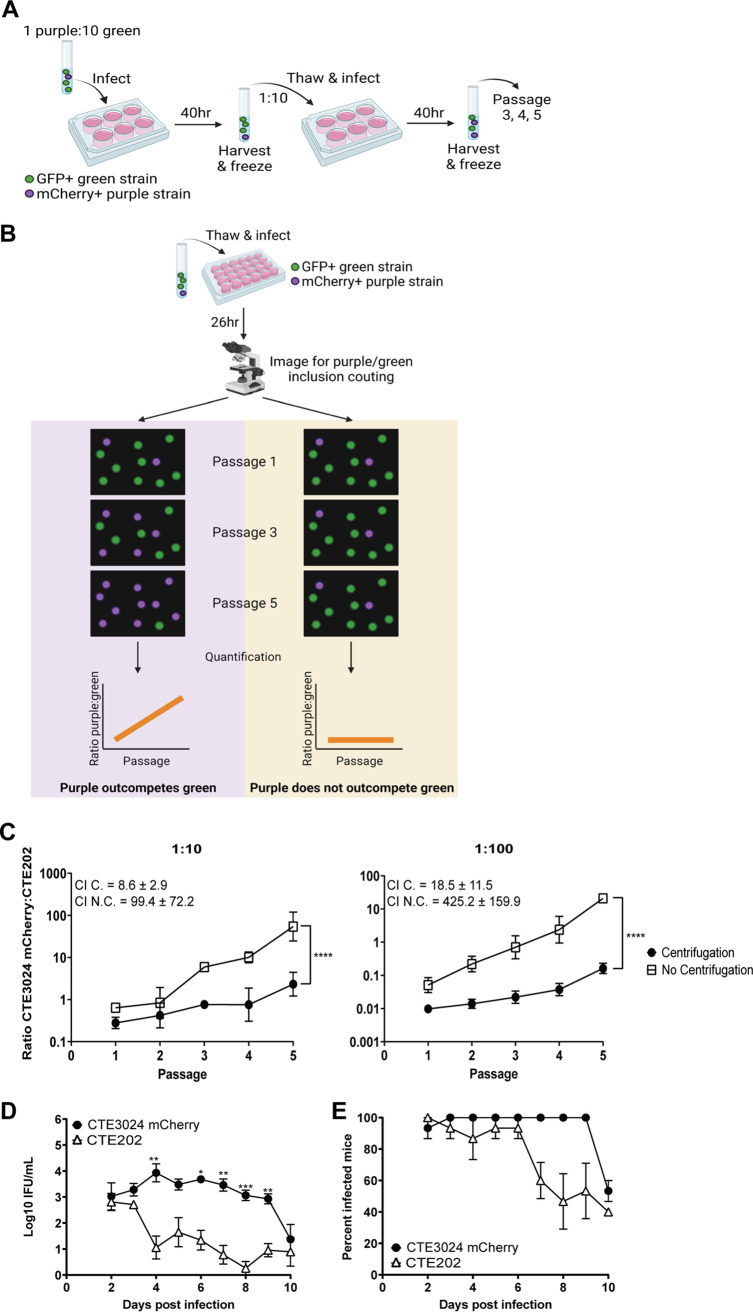
FIG 2.
CTE202 displays an infectivity defect in cell culture and in a mouse model of genital tract infection. (A) Cartoon depicting the workflow used for competition assays. GFP+ (depicted in green) and mCherry+ (depicted in purple) strains were mixed together and infected onto cell monolayers. At 40 h p.i., the monolayers were harvested and passaged onto new cell monolayers. This process continued for a total of five passages. (B) Schematic depicting the imaging and quantitation procedure used for competition assays. A portion of each passage from panel A was infected onto cell monolayers. GFP+ inclusions and mCherry+ inclusions were imaged and quantified, and the ratio of GFP+:mCherry+ was calculated. Graphing of ratios resulted in a line with a positive slope different from 0 (evidence of competition) or a flat line (no competition). The images in panels A and B were created using BioRender. (C) Quantification of the ratio of CTE3024 mCherry to CTE202 from passages of competition assays showed CTE3024 mCherry outcompeted CTE202 in the absence of centrifugation, but the ability to outcompete was significantly reduced by centrifugation. Data points represent the average ratios from two technical replicates ± SD. Slopes of the lines were compared to 0 (P ≤ 0.0001 [1:10, 1:100]) or to each other (P ≤ 0.0001 [1:10, 1:100]) by simple linear regression. Graphs shown are representative of 3 experiments. C., centrifugation; N.C., no centrifugation. (D) Similar to cell culture, CTE3024 mCherry was more infectious than CTE202 in a mouse model of infection. Five mice per group were infected transcervically with 5 × 10⁶ IFU/mL CTE3024 mCherry or CTE202. Infection was monitored via cervico-vaginal swab and quantified as IFU. Data points represent the mean ± standard error of the mean (SEM) of all mice from one of three representative experiments. P < 0.0001 by two-way ANOVA with repeated measures and Šídák’s multiple comparisons. *, P < 0.05; **, P < 0.005; ***, P < 0.0005. (E) Points represent the mean percent infected mice ± SD of three independent experiments. P = 0.004 by Wilcoxon signed-rank test.

