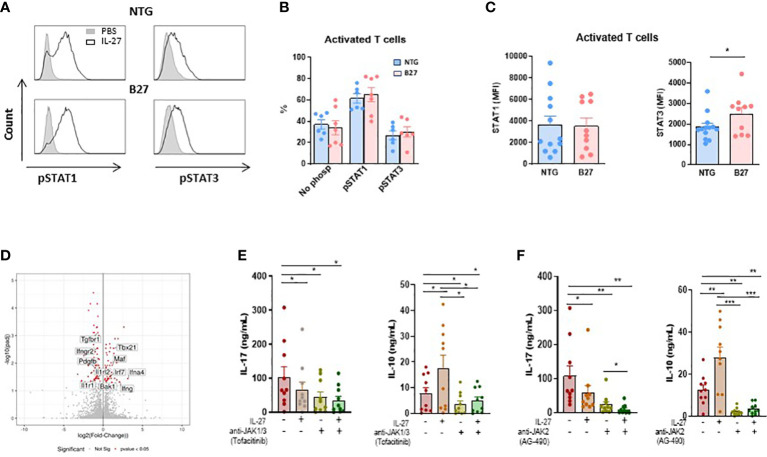
Figure 3.
JAK-STAT signaling is involved in IL-27 modulatory effect. (A) Representative histogram of mesenteric LN cells stimulated by IL-27 and stained intracellularly for phosphorylated STAT1 and STAT3 gated on CD4+ CD25+ activated T cells. (B) The percentage of pSTAT1 and pSTAT3 was analyzed in gated CD4+ CD25+ activated T cells from mesenteric LN of NTG and B27-rat aged of 4-5 months. (C) STAT1 and STAT3 levels were analyzed by flow cytometry in gated CD4+ CD25+ activated T cells from mesenteric LN of NTG and B27 rat. Values are the mean + SEM of 6-13 rats/group. *p<0.05. (D) Volcano plot representing the results of RNAseq analysis of differentiated Th17 cells in the presence of IL-27, as compared to medium control. The data for all genes are represented by log2 (fold change) vs. log10 of adjusted p-value. The significative different genes are highlighted in red. Values represent results from 5 rats/group. (E, F) IL-17 and IL-10 levels were determined by ELISA in supernatants from CD4+ CD25+ activated T cells after 3 days of stimulation with coated anti-CD3 in the presence of IL-27 and/or anti-JAK1/3-tofacitinib (E) and/or anti-JAK2-AG490 (F). Values are the mean + SEM of 10 rats/group. *p < 0.05; **p = 0.001; ***p = 0.0005.

