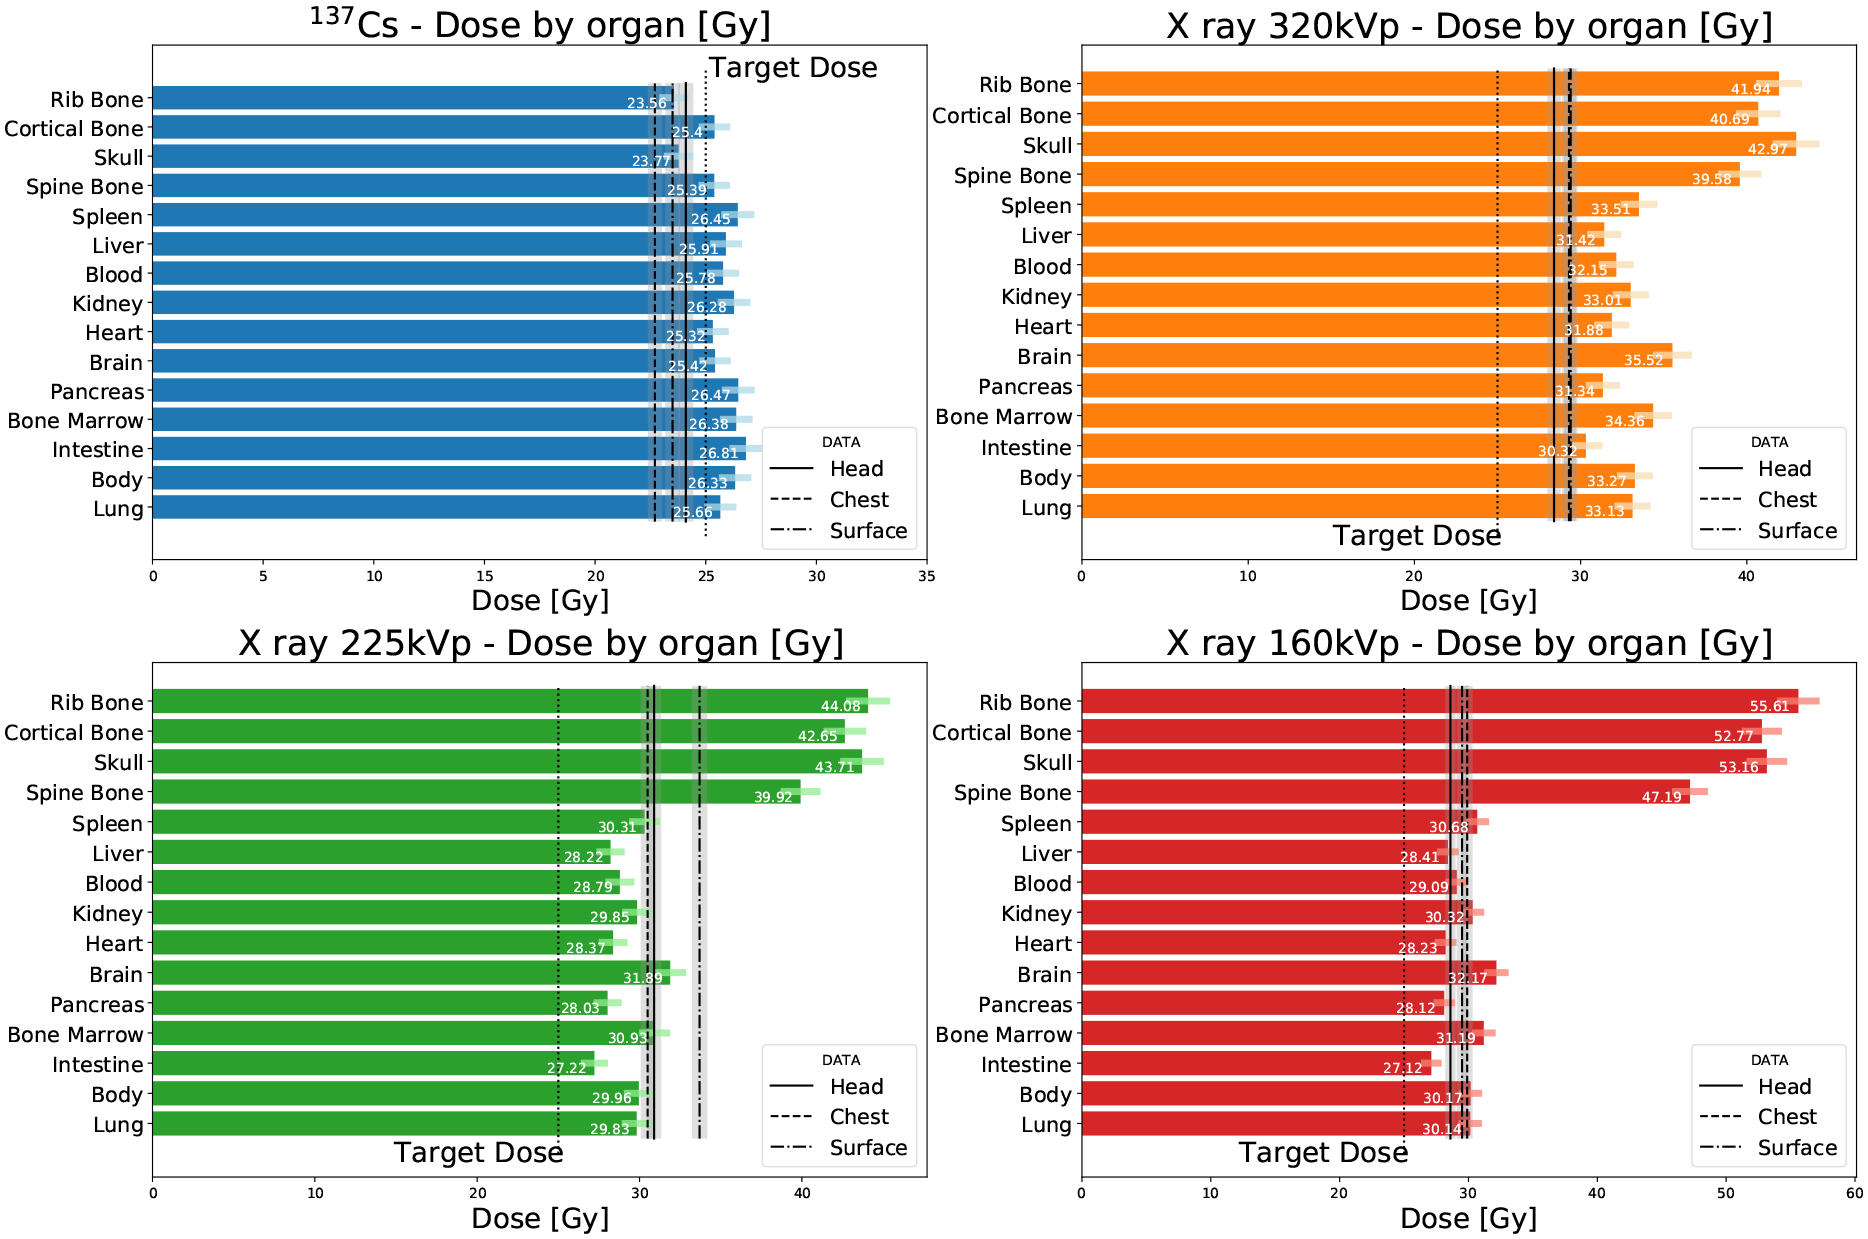
Figure 12.

Organ-specific doses calculated from the digital mouse phantom compared to the measured doses in the carcass. Uncertainties for data are marked with a gray shaded region, and as a color error bar for Monte Carlo.

Organ-specific doses calculated from the digital mouse phantom compared to the measured doses in the carcass. Uncertainties for data are marked with a gray shaded region, and as a color error bar for Monte Carlo.