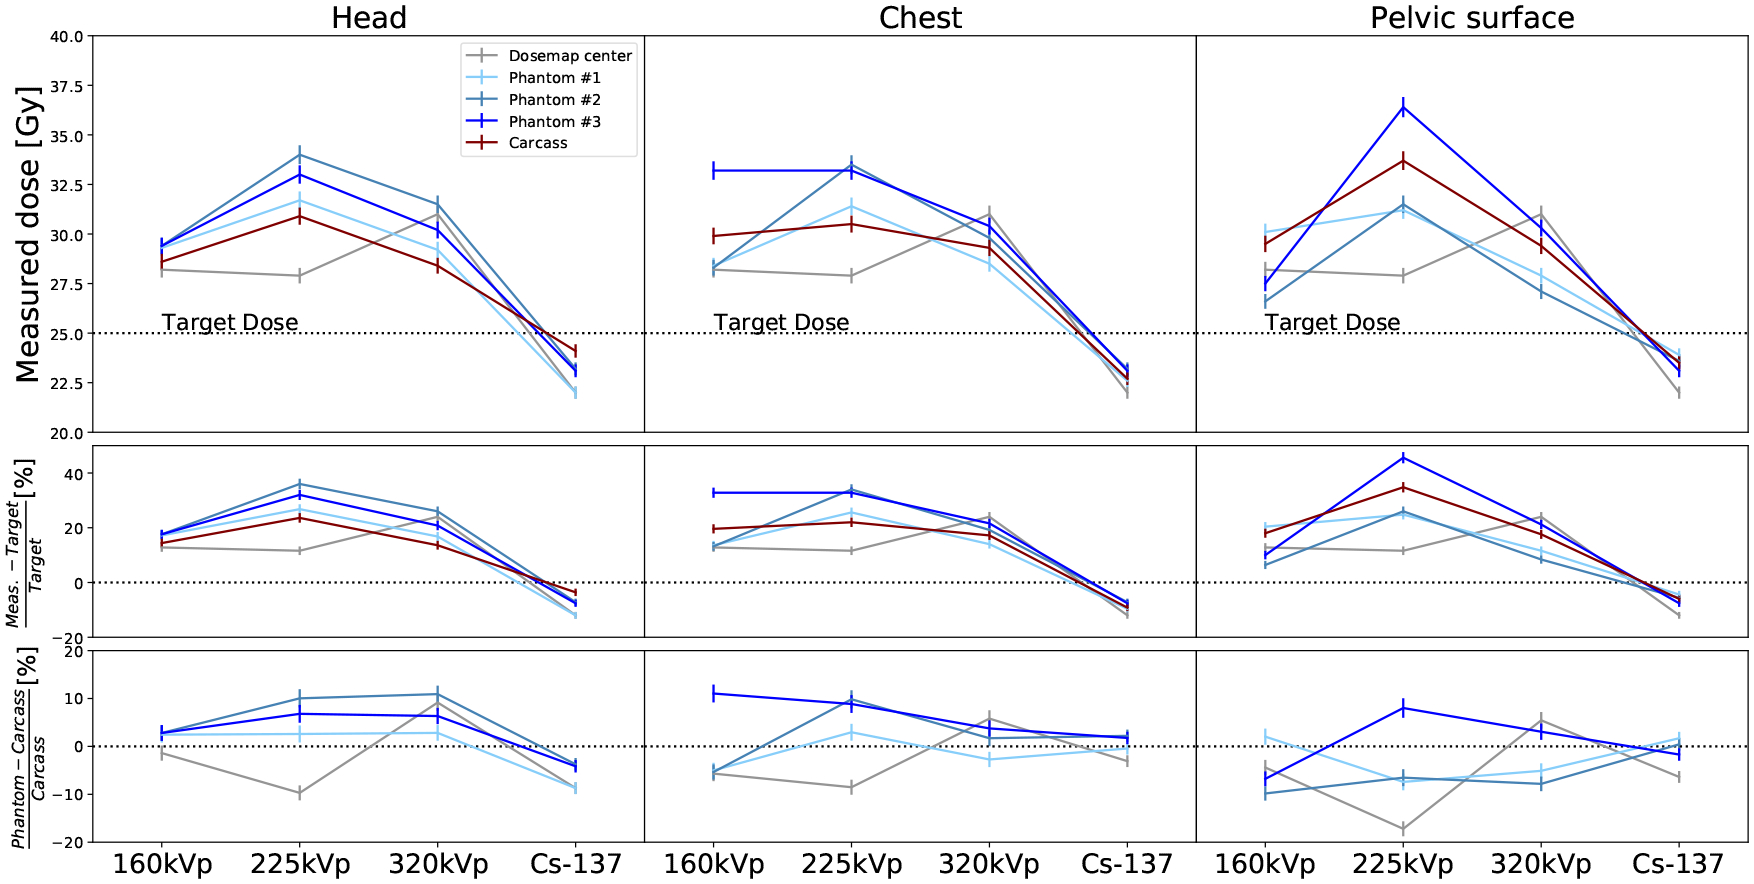
Figure 6.

Measured doses from low to high photon energy for the different subjects: carcasses (red), RBPs (blue), and Dose-Maps™ (gray). The doses are reported for the three different locations in the mouse, from left to right: head, chest and pelvic surface. The top row shows the absolute dose for each energy, subject and location. The Dose-Map™ line corresponds to the dose at the center of the cassette. The central row is the bias from the target dose (BT) and the bottom row corresponds to the bias from the dose in the carcass (BC).
