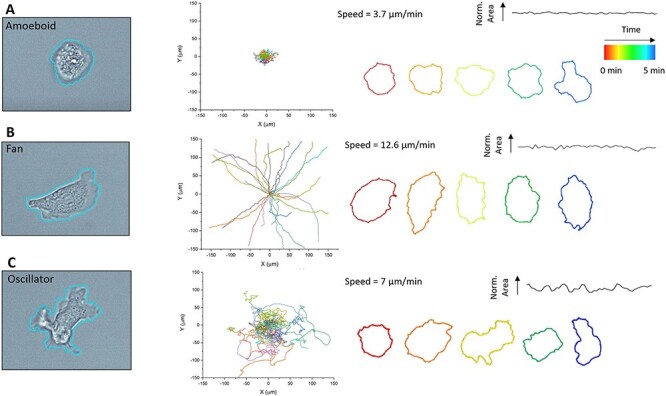
Figure 2.

SSL segmentation and tracking of distinct Dictyostelium phenotypes. (Left) Representative SSL segmentation overlays of (A) amoeboid, (B) fan and (C) oscillator cells. (Middle) The centroid tracks of each phenotype of migrations (10 min in the field of view), with each track a different color and reset to the same origin (n = 25 cells for ease of visualization). (Right) Temporal morphological profiles of individual cells highlight the distinct morphological characteristics of each phenotype, with normalized spread area versus time profile and migration speed shown. Source: See the original results in Figure 1C and D in Ref. (15) for comparison.
