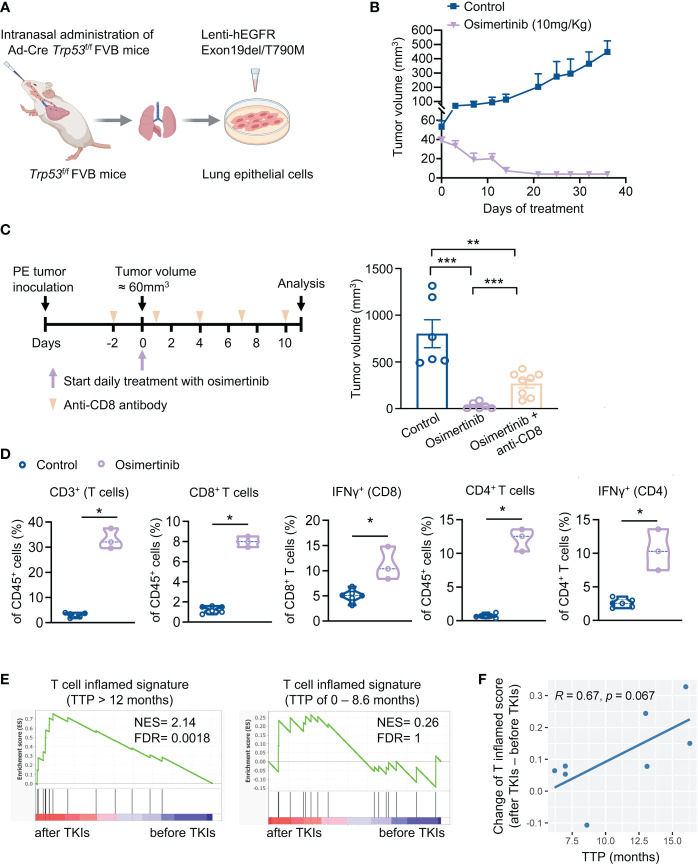
Figure 1.
Osimertinib-elicited activation of T cells is important for the anti-tumor efficacy of osimertinib in vivo. (A) Generation of a syngeneic GEMM of EGFR-mutant tumors driven by Exon19del/T790M EGFR and loss of Trp53 (referred as PE). (B) PE tumor growth in FVB mice treated with or without osimertinib. Treatment was started when tumor volume reached approximately 60 mm3. Control, n = 4; osimertinib (10 mg/kg, p.o., q.d.), n = 6. (C) PE tumor-bearing FVB mice were treated with osimertinib (10 mg/kg, p.o., q.d.) with or without an anti-CD8 neutralizing antibody. Left, schedule of tumor inoculation and treatments. Right, tumor volumes were measured after 11 days of treatment. Control, n = 6; osimertinib, n = 6; osimertinib + anti-CD8, n = 8. (D) Flow cytometry analysis of PE tumors in FVB mice after 11 days of osimertinib (10mg/kg) treatment. Treatment was started when tumor volume reached approximately 60 mm3. Each dot represents data from a single tumor. (E, F) Analysis of a cohort of eight patients with EGFR-mutant lung cancers who received an EGFR-TKI (osimertinib or erlotinib) as the first-line treatment. (E) Analysis of T cell inflamed signature in matched pairs of lung tumor biopsy collected before and after treatments. Left, patients with prolonged response [time to progression (TTP) > 12 months], n = 4 patients. Right, patients with short duration of response (TTP of 0 – 8.6 month), n = 4 patients. (F) Pearson correlation analysis of TTP with changes of enrichment scores of T cell inflamed signature upon EGFR-TKI treatments. Each dot represents one patient. n = 8 patients. Data are presented as mean ± SEM (B, C) or median with quartiles (violin plots, D). Two-tailed unpaired t test (C, D). *P < 0.05, **P < 0.01, ***P < 0.001.

