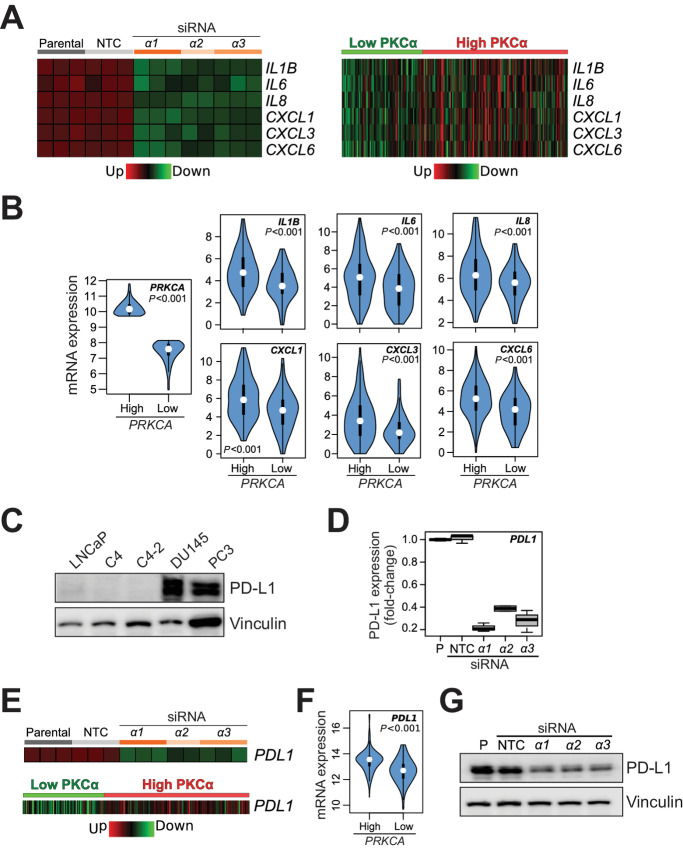
FIGURE 8.
Association of PKCα with proinflammatory and/or tumorigenic cytokines and PD-L1 expression in human prostate cancer. A, Heatmaps for the cytokines and/or chemokines regulated by PKCα. Left, Expression upon PKCα RNAi silencing in PC3 cells, as determined by RNA-seq. Right, Expression in “High PKCa” and “Low PKCa” human prostate tumors from TCGA-PRAD. NTC, non-target control. B, Violin plots indicating P values for the comparison of cytokine expression in “High PKCa” and “Low PKCa” human prostate tumors from TCGA-PRAD. C, Representative Western blot analysis for PD-L1 expression in prostate cells. D, Inhibition of PD-L1 expression in PC3 cells by PKCα RNAi silencing, as determined by RNA-seq. E, Heatmaps for PD-L1. Top, Expression upon PKCα RNAi silencing in PC3 cells, as determined by RNA-seq. Bottom, Expression in “High PKCa” and “Low PKCa” human prostate tumors from TCGA-PRAD. F, Violin plots indicating P value for PD-L1 expression in “High PKCa” and “Low PKCa” human prostate tumors from TCGA-PRAD. G, PD-L1 protein expression was determined by Western blot analysis in PC3 cells, 48 hours after transfection with siRNA duplexes for PKCα (α1, α2, α3) or NTC.

