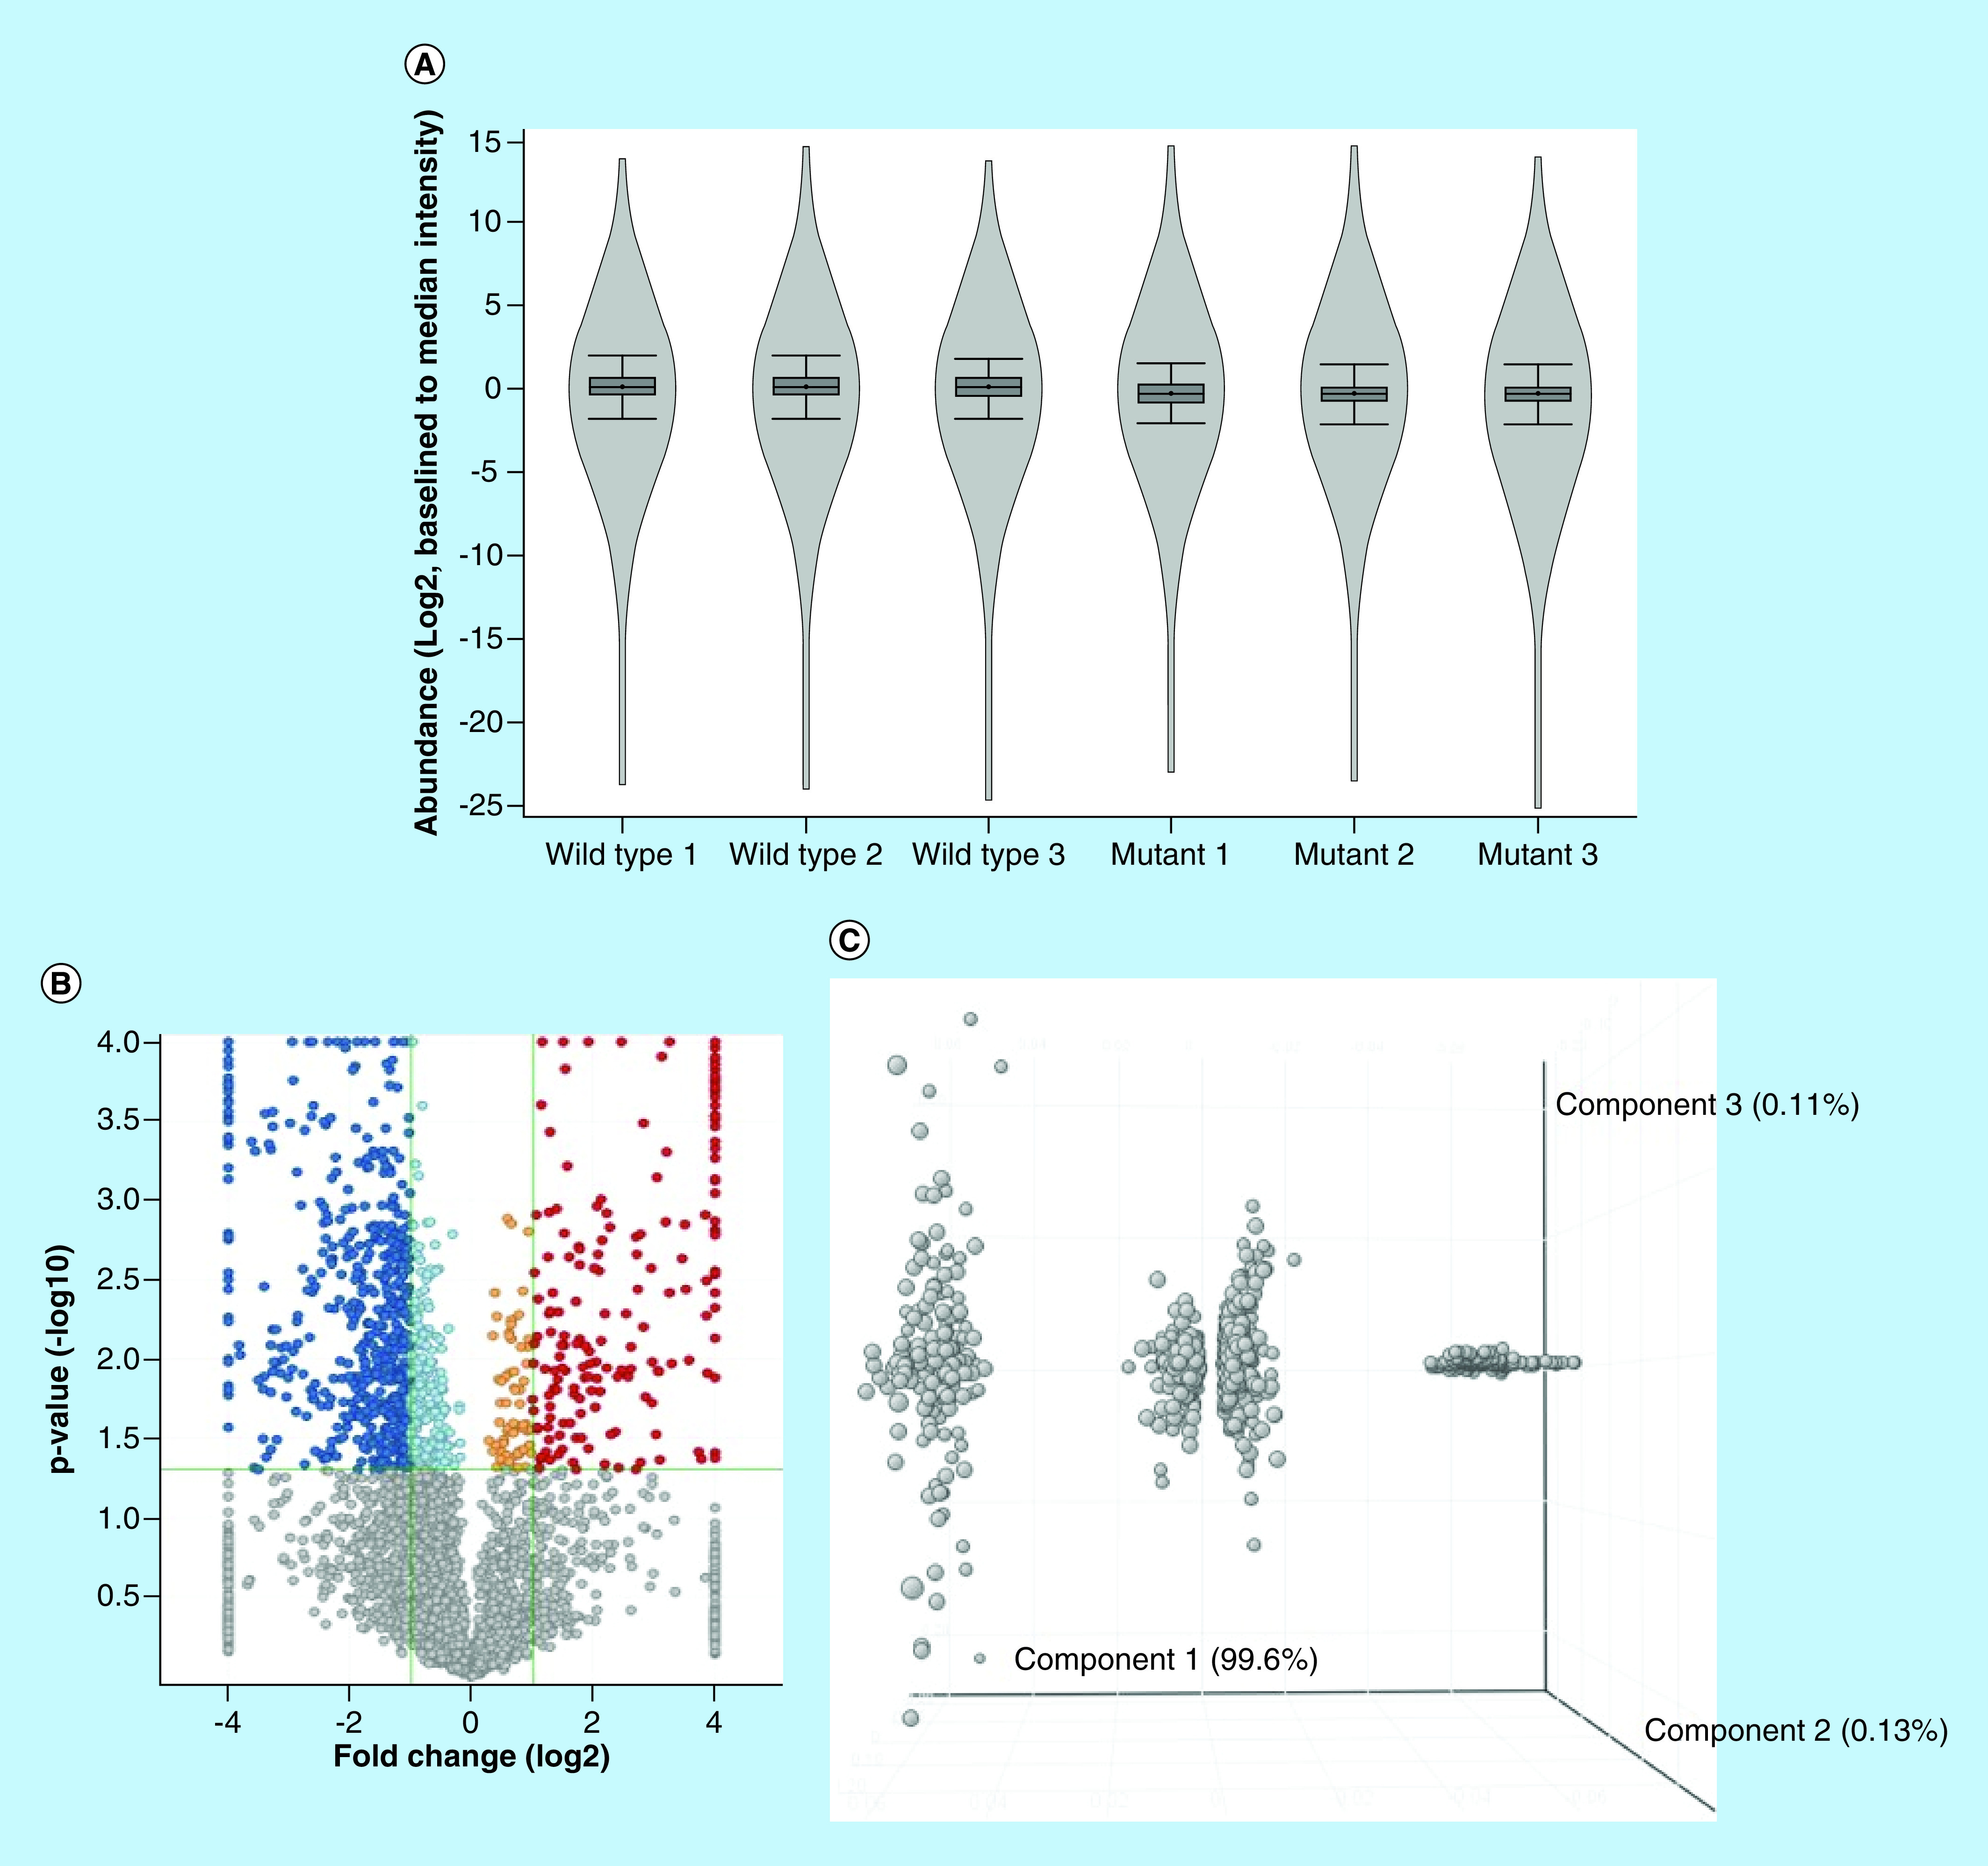
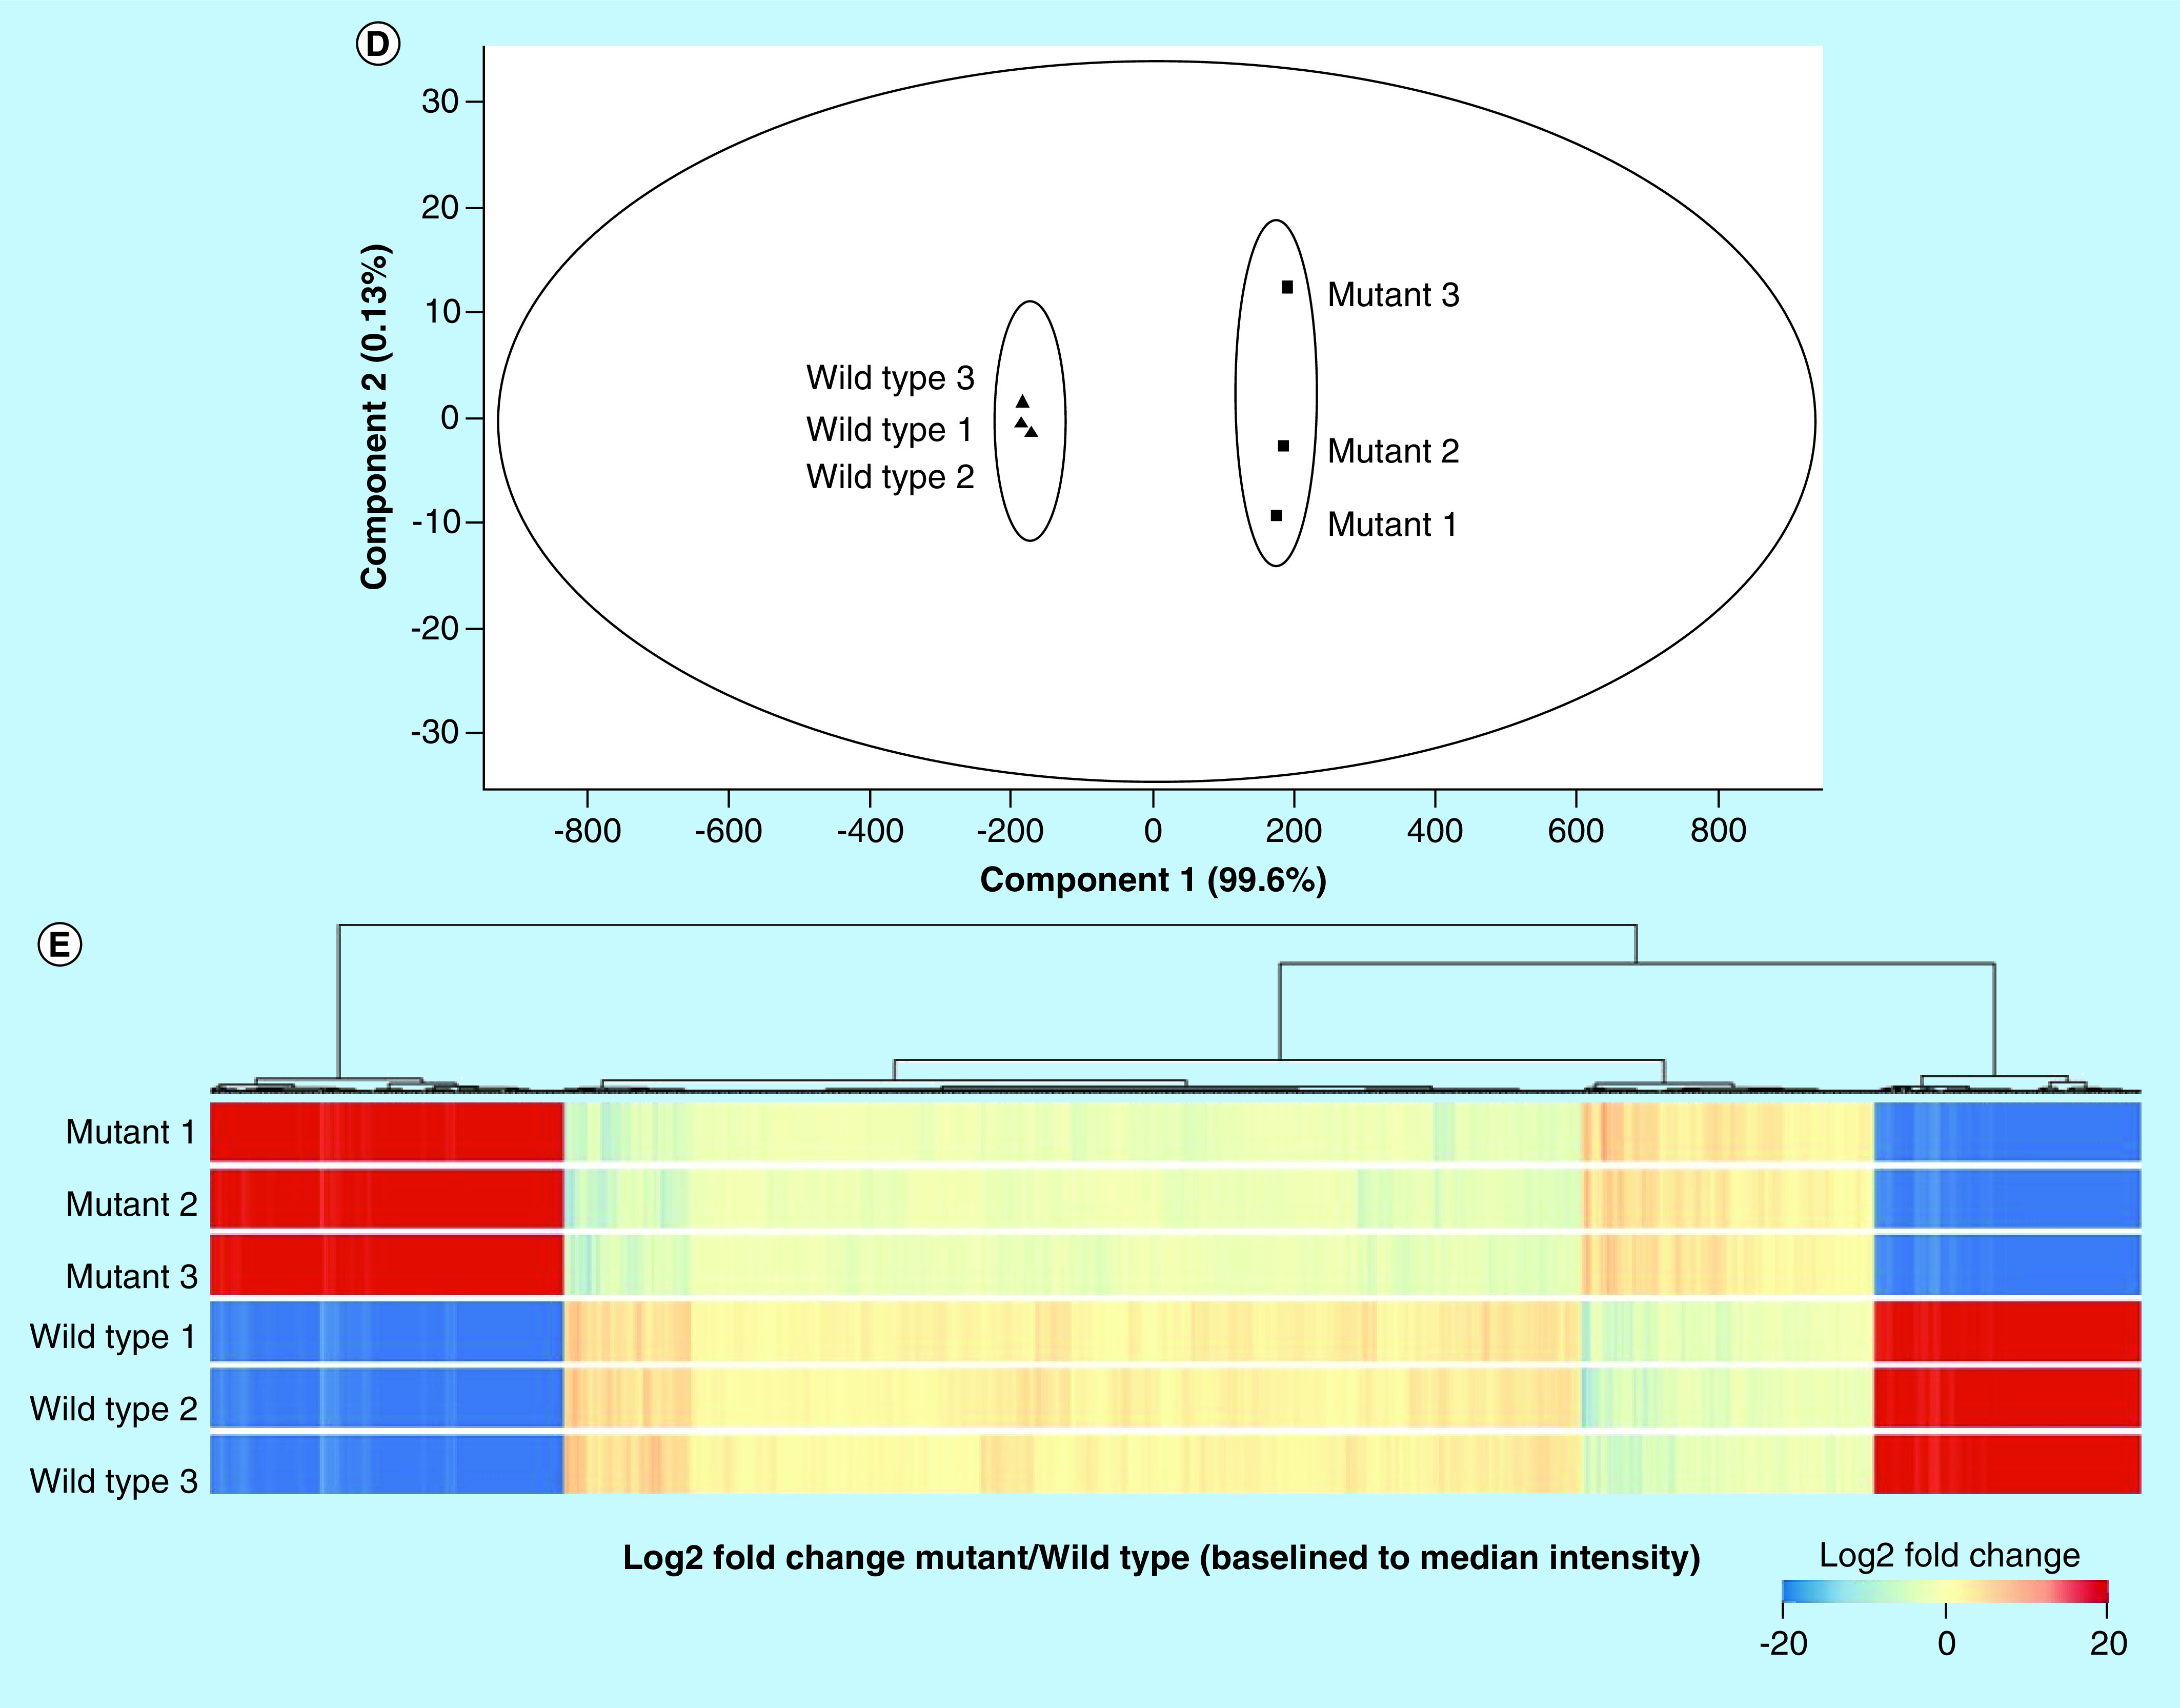
Figure 2. . Statistical analysis of the fractionated liver proteome for 11-week Npc1+/+ and Npc1-/- mice.


(A) Violin plot showing the distribution and density of measured proteins, (B) Volcano plot depicting the distribution of significantly altered proteins (dark blue is upregulated fold change ≥2, light blue is upregulated fold change <2, orange is upregulated fold change <0.5 and dark red is downregulated fold change ≥0.5, grey is p ≥ 0.05), (C) Principle component analysis of statistically differential proteins indicating that there is only one main component (disease) driving the alteration of the measured proteins, (D) principle component analysis of Npc1-/- and Npc1+/+samples, indicating that there is only one main component (disease) driving the separation between the two groups and (E) Heatmap of all measured proteins. All fold changes are noted as Npc1-/- relative to Npc1+/+.
