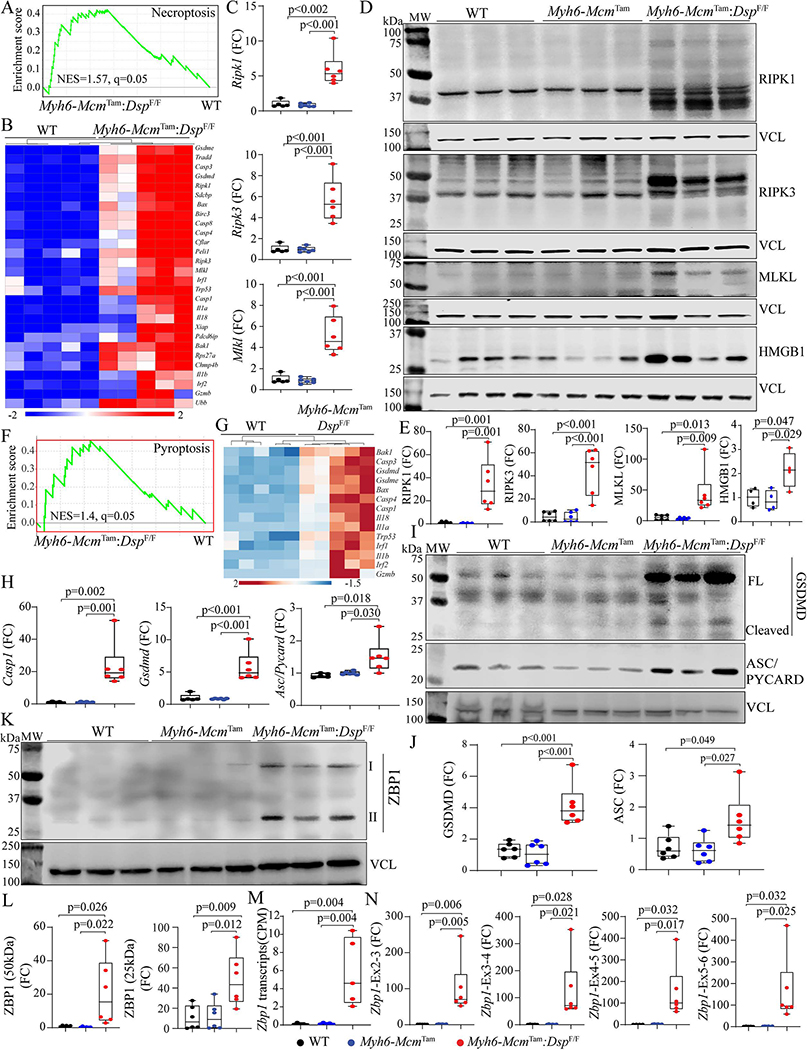
Figure 4.
Activation of necroptosis and pyroptosis in the Myh6-McmTam:DspF/F mice. (A) GSEA plot showing enrichment of genes involved in necroptosis in the Myh6-McmTam:DspF/F cardiac myocytes. (B) A heap map of the DEGs showing upregulation of genes involved in necroptosis in the Myh6-McmTam:DspF/F cardiac myocytes. (C) Dot plots showing transcript levels of Ripk1, Ripk3, and Mlkl in the isolated cardiac myocytes, as detected by RT-PCR. (D) Immunoblots showing expression of RIPK1 (cleaved), RIPK3, MLKL, and HMGB1 in the cardiac protein extracts in the experimental groups. (E) Dot plots showing quantitative data representing the blots in panel D. (F) GSEA plot showing enrichment of genes involved in pyroptosis in the Myh6-McmTam:DspF/F cardiac myocytes. (G) A heap map of the DEGs showing upregulation of genes involved in pyroptosis in the Myh6-McmTam:DspF/F cardiac myocytes. (H) Dot plots showing transcript levels of Casp1, Gsdmd, and Asc (Pycard) in the isolated cardiac myocytes, as detected by RT-PCR. (I) Immunoblots showing expression of GSDMD and ASC (PYCARD) in the cardiac myocyte protein extracts in the experimental groups. (G) Dot plots showing quantitative data representing the blots in panel I. (K) Immunoblot showing expression of two isoforms of ZBP1 proteins in cardiac myocyte protein extracts. (L) Dot plots showing quantitative data representing the blots in panel K. Each ZBP1 isoform is analyzed separately. (M) Zbp1 transcript read numbers in the cardiac myocytes RNA-Seq data presented as copy per million reads (CPM). (N) Dot plots showing transcript levels of the Zbp1 genes, using multiple sets of oligonucleotide primers to detect its isoforms.

