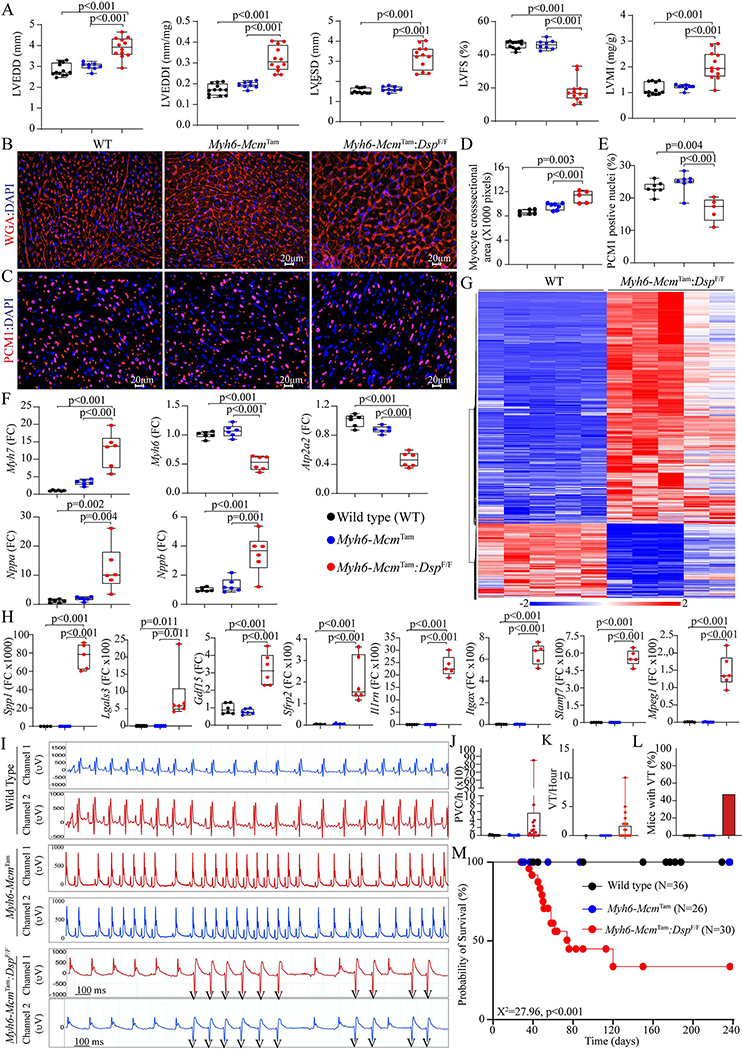
Figure 6.
Cardiac dysfunction, arrhythmias, and survival in the Myh6-McmTam:DspF/F mice. (A) Dot plots depicting selected indices of cardiac size and function. (B) Immunofluorescence panels showing wheat germ agglutinin (WGA) stained thin myocardial sections. (C) Immunofluorescence panels showing thin myocardial sections stained with an antibody against pericentriolar material 1 (PCM1) to mark myocyte nuclei in the heart. (D) Dot plots representing myocyte cross-sectional areas in the experimental groups, calculated from the WGA-stained sections and corrected for the number of PCM1-tagged myocytes. (E) Dot plots depicting the number of PCM1-tagged myocytes in the experimental groups. (F) Dot plots showing transcript levels of selected markers of cardiac hypertrophy and failure. (G) Heat map depicting DEGs whose protein products are expected to be secreted (secretome), illustrating upregulation of most genes coding for the secretome in the Myh6-McmTam:DspF/F cardiac myocytes. (H) Dot plots showing transcript levels of several genes encoding the secretome in the cardiac myocytes in the experimental groups. (I) Two-lead surface electrocardiographic strips showing premature ventricular complexes (PVCs) and runs of non-sustained ventricular tachycardia (NSVT) in the Myh6-McmTam:DspF/F mice. (J) Dot plots depicting the number of PVCs per hour detected in the WT, Myh6-Mcm Tam, and Myh6-McmTam:DspF/F mice. (K) Dot plots showing the number of NSVT episodes in the experimental groups. (L) Bar graph showing the number of mice showing NSVT episodes. (M) Kaplan-Meier survival plots in the experimental groups. Each circle identified one mouse alive at that point and each vertical drop indicated a death.

