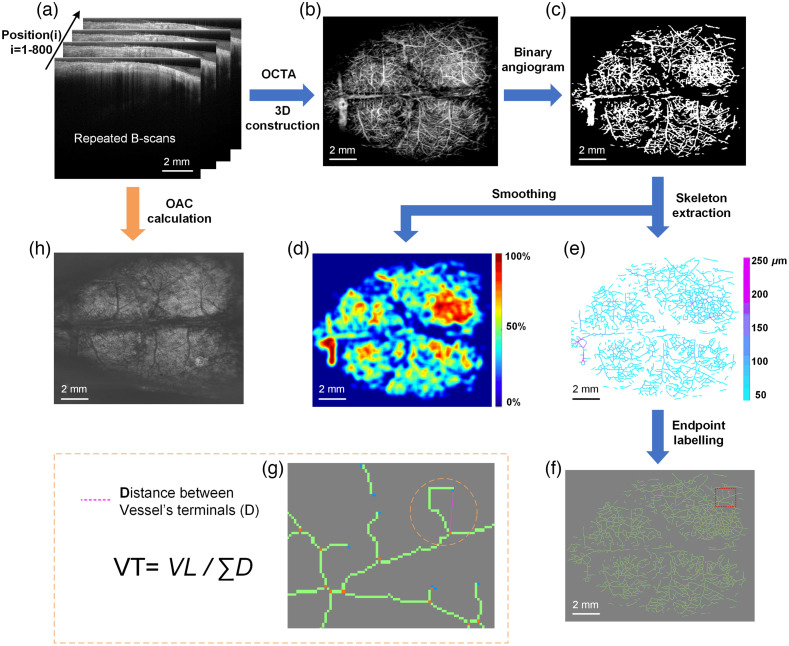
Fig. 1.
Overview of data processing procedures. (a) The original structural images acquired by SS-OCT. Scans are repeated four times at each position and a total of 800 positions were collected. (b) OCT angiogram. (c) Binary angiogram. (d) VPD image. (e) Vascular skeleton image. (f) Vascular skeleton image with vessel branch terminals labeled (orange dots: branch nodes, blue dots: endpoints). (g) Enlarged view of the red box in (f). (h) OAC image.

