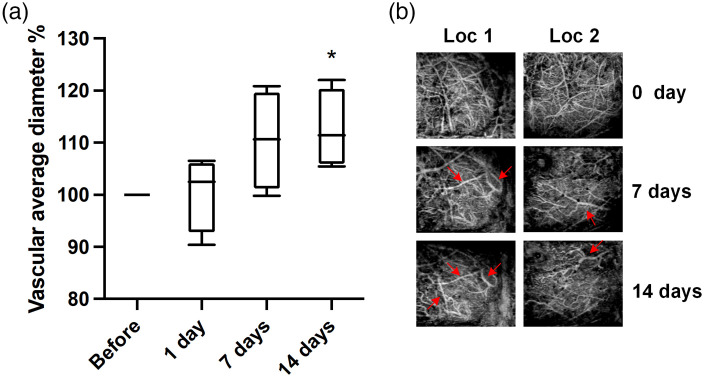
Fig. 5.
VAD changes after peptide injection. (a) Total VAD presented as a percentage of the value obtained before peptide treatment (before) and plotted over time. Each bar represents the group mean ± S.E.M, significant differences between certain group and before denoted *. (b) Locations (Loc) where vascular diameters were visibly greater compared to untreated brain, indicated by red arrows. Each column represents the same location.

