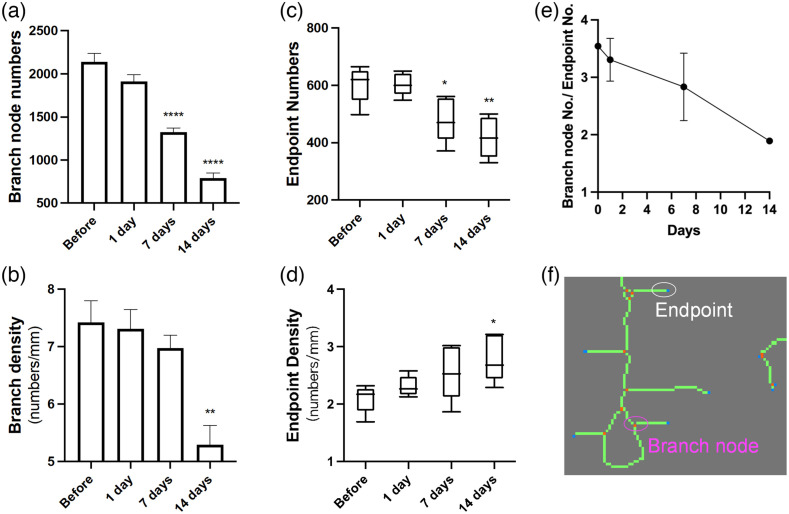
Fig. 7.
The effect of on vascular branching and fragmentation. (a) The branch node numbers based on calculating orange dots illustrated in (f) in the entire brain at different time points. (b) Branch density is defined as the branch node numbers divided by VL. (c) Endpoint numbers based on counting blue dots shown in (f) in the whole brain image. (d) Endpoint density is the ratio of endpoint numbers to the VL. (e) The ratio of branch node numbers/endpoint numbers is plotted over time. (f) A representative local area of the vascular skeleton image with branch nodes (orange dots) and endpoints (blue dots) labeled.

