Fig. 1.
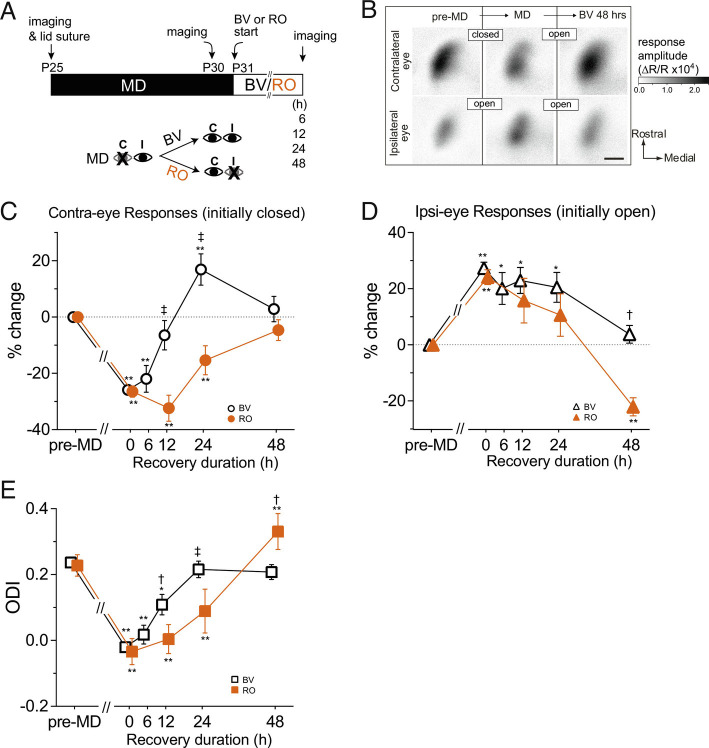
Faster recovery of deprived-eye responses by binocular vision than by reverse occlusion. (A) Experimental schedule for repeated optical imaging of intrinsic signals. MD: monocular deprivation of contralateral eye. BV: binocular vision, open symbols in C–E. RO: reverse occlusion, filled symbols in C–E. (B) Example of changes in response magnitude in an animal undergoing MD followed by recovery by BV. The gray scale represents the response magnitude as a fractional change in reflectance. Scale bar, 0.5 mm for all panels. (C) Changes in the response magnitude to the contralateral deprived eye (closed → open) during recovery. (D) Changes in the response magnitude to the ipsilateral eye (open → open for BV, open → closed for RO) during recovery. (E) Shift in ocular dominance during recovery calculated from data in C and D. Data in C and D are presented as % change from pre-MD baseline. Dotted lines in C and D represent the baseline level. All graphs show mean ± SEM. Sample size: BV-6 h (4), BV-12 h (5), BV-24 h (5), BV-48 h (5), RO-12 h (5), RO-24 h (5), RO-48 h (6). *P < 0.05, **P < 0.01 vs. pre-MD baseline, repeated measure ANOVA followed by multiple comparisons with Bonferroni’s correction. †P 0.05, ‡P < 0.01 between BV and RO, one-way ANOVA followed by multiple comparisons with Bonferroni’s correction.

