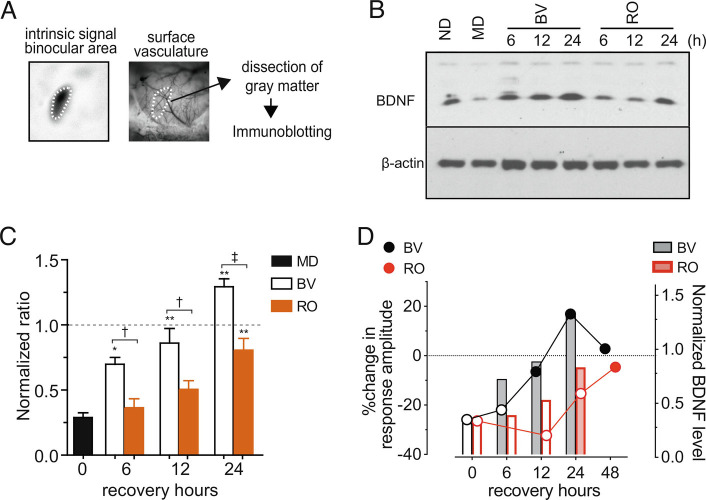
Fig. 3.
Rapid upregulation of BDNF in the primary visual cortex during recovery by binocular vision. (A) Dissection of the binocular visual cortex that has been localized using the surface vascular pattern and the intrinsic signal image. (B) An example of the immunoblot for mBDNF. Beta-actin was used as a loading control. (C) Quantification of density of the immuno-blot. The magnitude of the BDNF signal was first normalized with the corresponding beta-actin signal and then normalized with the magnitude of no deprivation (ND) control in the same experiment. Data are presented as mean ± SEM. Sample size is five pairs for each condition. MD: monocular deprivation, BV: binocular vision following 5 d of MD, RO: reverse occlusion following 5 d of MD. *P < 0.05 and **P < 0.01 vs. MD; †P 0.05 and ‡P < 0.01 between BV and RO; all statistical analyses were done by one-way ANOVA followed by multiple comparisons with Bonferroni’s correction. (D) Comparison between physiological recovery of deprived-eye responses (on the left ordinate, from Fig. 1C) and mBDNF upregulation (on the right ordinate, from Fig. 3C) during BV or RO following MD. Filled symbols and open symbols represent statistically significant and insignificant changes, respectively, from the post-MD, 0 h recovery point.

