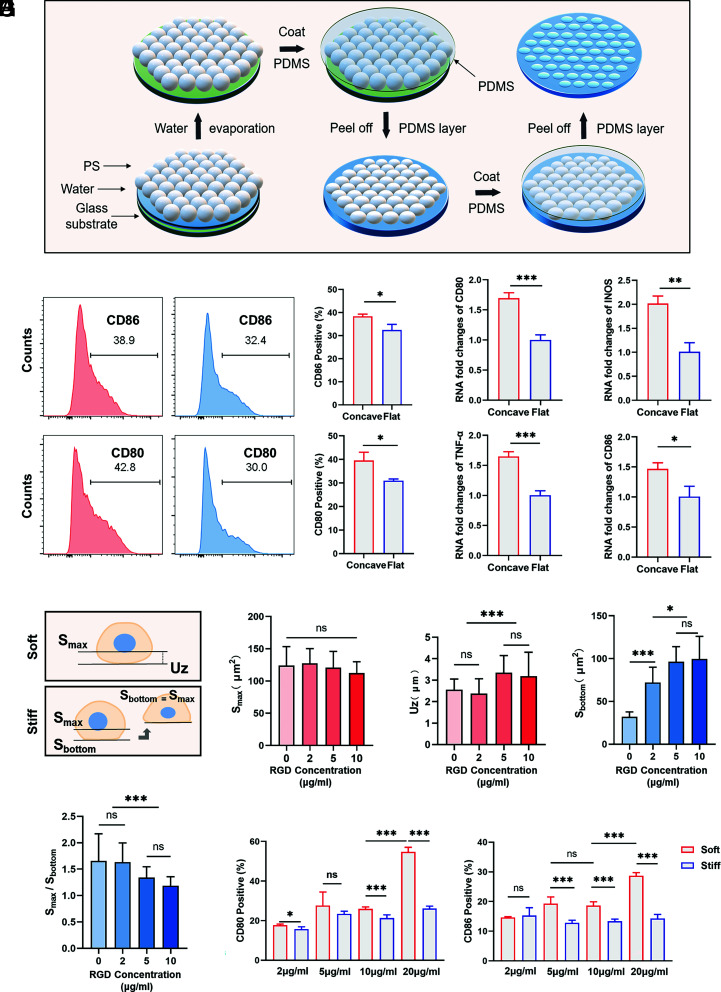
Fig. 3.
Plasma membrane deformation affects macrophage function, and macrophages show differences in membrane deformation on soft and stiff substrates. (A) Schematic of the concave substrate preparation process. (B and C) RAW264.7 cells were cultured on concave and flat substrates for 24 h. Flow cytometry (n = 3; *P = 0.0146, *P = 0.0180) and RT–PCR (n = 3; *P = 0.016, **P = 0.002) were performed to examine the expression of inflammatory markers and factors. Two-tailed Student’s t test. (D) Schematic illustration. On soft substrates, because it is difficult to calculate the bottom adhesion area, the vertical distance between the plane of maximum circumference on the z-axis and the lowest point of cell adhesion is defined as Uz. On stiff substrates, the area of maximum cell circumference and the area of cell bottom adhesion were recorded as Smax and Sbottom. (E–H) The concentration of ligands on the hydrogel surface was changed to quantify Uz (n = 20) and Smax on the soft substrates (n = 20) and Smax and Sbottom on the stiff substrates (n = 24). (I) Flow cytometry analysis of macrophage responses to soft and stiff hydrogel substrates when the concentration of ligands on the hydrogel surface is changed (n = 5; *P = 0.03). Unless otherwise stated, the data presented were analyzed by one-way ANOVA with Tukey’s posttest. *P < 0.033, **P < 0.002, ***P < 0.001; ns, no significant difference.

