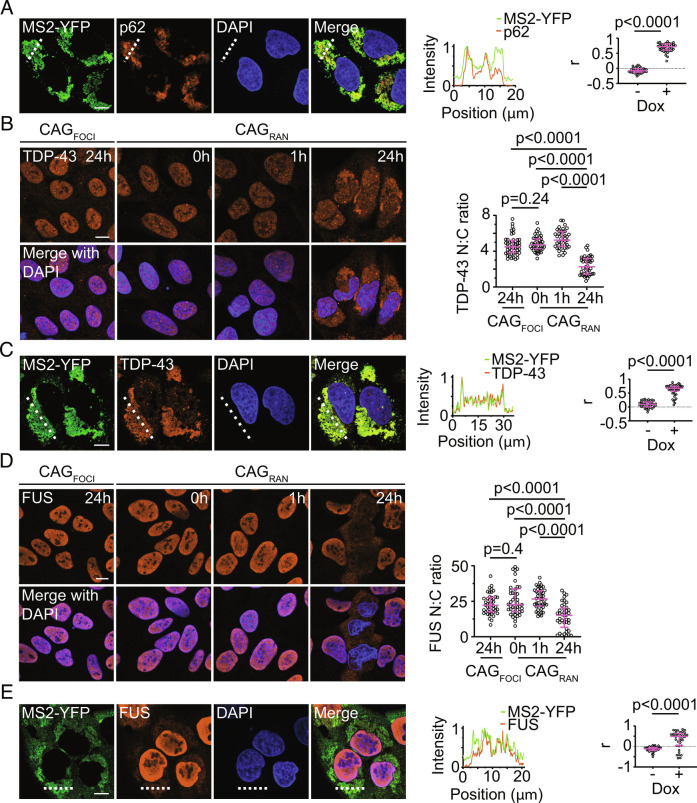
Fig. 3.
RNA–RAN protein aggregates recruit nuclear RNA-binding proteins. A, Representative immunofluorescence micrographs showing colocalization between CAGRAN RNA and p62 (Left), and intensity profile of the two channels along the dashed line (Middle). Correlation between MS2–YFP and p62 signals with (+) and without (−) RNA induction (Right). B, Representative immunofluorescence micrographs showing TDP-43 in cells expressing CAGFOCI or CAGRAN for the stated times (Left). Quantification of the ratio of nuclear to cytoplasmic TDP-43 (Right). C, Similar to A except staining for TDP-43 instead of p62. D, Similar to B except staining for FUS instead of TDP-43. E, Similar to A except staining for FUS instead of p62. Cell nuclei are stained with DAPI. Data are representative of ≥2 independent experiments with ≥40 cells. Each data point represents a single cell and data are summarized as median ± interquartile range. Significance values were calculated by Mann–Whitney U tests. (Scale bars, 10 µm.)

